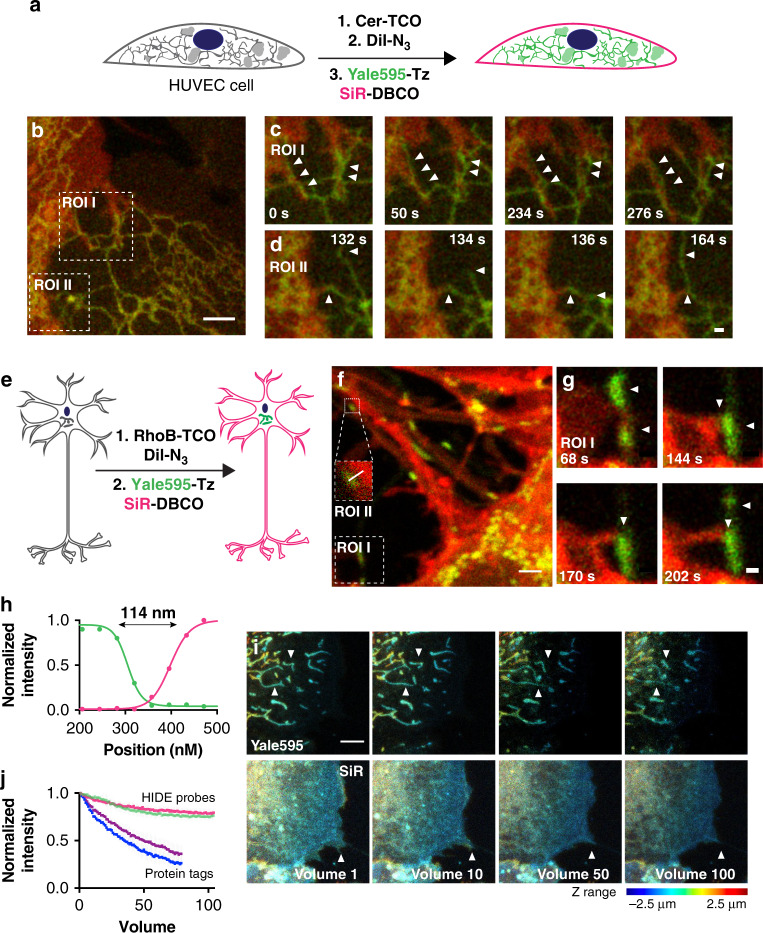
Fig. 4. Application of two-color HIDE probes to primary cell lines.
a Schematic illustration of the three-step procedure employed to label the plasma membrane and ER of Human umbilical vein endothelial cells (HUVECs). b Snapshot of a two-color STED movie of HUVEC. Scale bar: 2 μm. c, d Time-lapse images of ER dynamics and interactions between filopodia and ER. Scale bars: 500 nm. e Schematic illustration of the two-step procedure employed to label the plasma membrane and mitochondria of DIV4 mouse hippocampal neurons. f Snapshot of a two-color STED movie of DIV4 mouse hippocampal neurons. Scale bar: 2 μm. g Time-lapse images of interactions between filopodia and mitochondria. Scale bars: 500 nm. h Plot of line profile shown in (f, ROI II) illustrating the distance between plasma membrane and mitochondria. i Time-lapse two-color confocal imaging of mitochondria and plasma membrane in retinal pigment epithelium (RPE) cells. The mitochondrial and plasma membrane volumetric dynamics are recorded continuously over seconds. The axial information is color-coded. Twenty z-stacks per volume. volume rate: 6.1 s. Scale bar: 2 μm. j Plot illustrating normalized fluorescence intensity of RhoB-Yale595 (green), DiI-SiR (red), SMO25-Yale595 (purple), and Smo-SiR (blue) over time (mean ± standard deviation, n = 3 region of interest, N = 1 cell).

