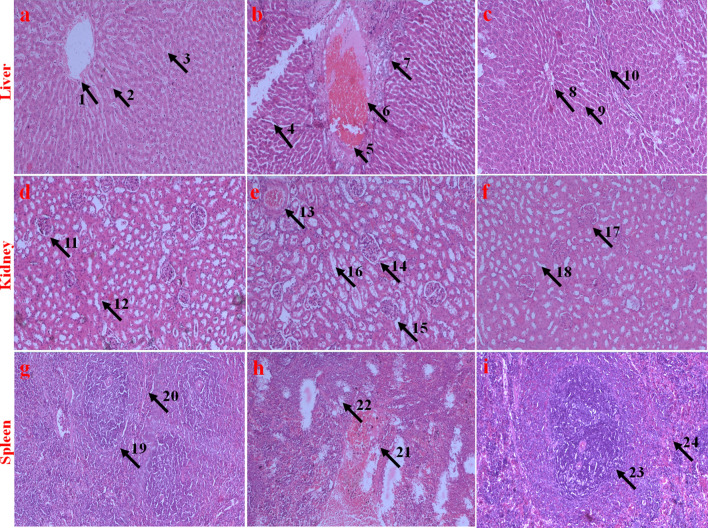
Figure 14.
Histopathological evaluation (HE staining, 10 ×) of vital organs (Liver, Kidney, and spleen) of Charles Foster strain rats treated with highest dose of soluble curcumin and MoS2 QDs. (a), (d), (g) are liver, kidney and spleen sections of the untreated control group I; (b), (e), (h) are liver, kidney, and spleen sections of MoS2 QDs treated group II; and (c), (f), and (i) are liver, kidney and spleen sections of Group VI (highest dosed group). Labels (arrow and numeral) on the images indicate various regions of the tissues. (1) Undamaged central vein of group I. (2, 3) Compact and healthy hepatocytes of group I. (4) Damaged central vein of group II. (5) Dilated central vein of group II. (6,7) Degenerated, necrotized, vacuolated, and diffused hepatocytes of group II. (8) Undamaged central vein of group VI. (9, 10) Compact and healthy hepatocytes of group VI. (11) Healthy glomerulus and Bowman’s space of group I. (12) Healthy and undistorted loops of group I. (13) Necrotized glomerulus and Bowman’s space of group II. (14) Swollen glomerulus and dilated Bowman’s space of group II. (15) Regressed glomerulus and Bowman’s space of group II. (16) Distorted loops of group II. (17) Healthy glomerulus and Bowman’s space of group VI. (18) Healthy and undistorted loops of group VI. (19) Red pulp of the group I. (20) White pulp of the group I. (21) Regressed/necrotized red pulp of group II. (22) Regressed/ necrotized white pulp of group II. (23) Intact red pulp of group VI. (24) Intact white pulp of group VI.

