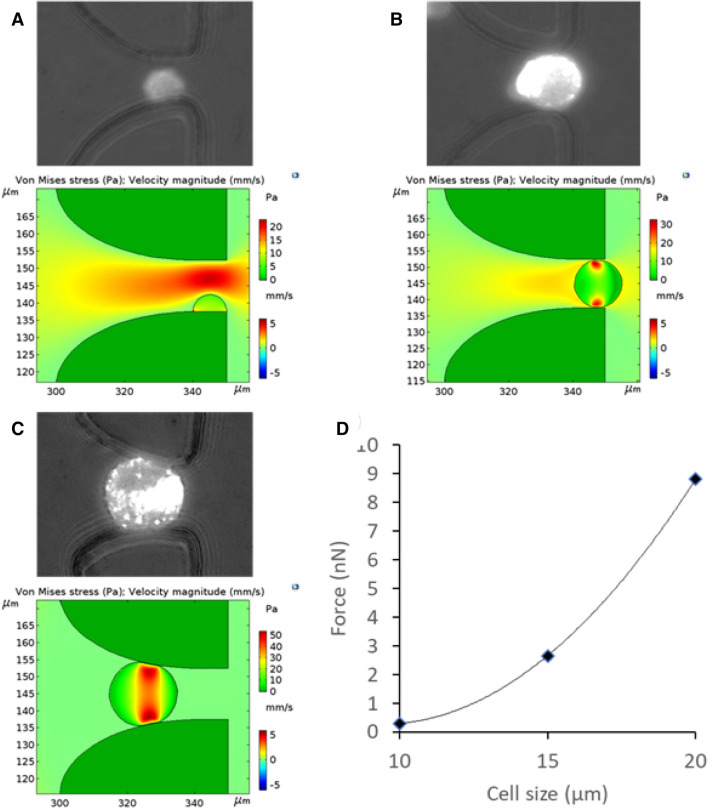
Figure 3.
Hydrodynamic force analysis of a cell captured in a filter by immunoaffinity. (A) Top: picture of a cell captured in a filter by immunoaffinity. The cell has a diameter smaller than the filter. Bottom: shear stress distribution on the surface of the cell simulated using COMSOL Multiphysics. (B) Same as (A) except that the cell diameter is the same as the filter. (C) Same as (A) except that the cell diameter is bigger than the filter. (D) The hydrodynamic force experienced by a cell is plotted as a function of the cell size.

