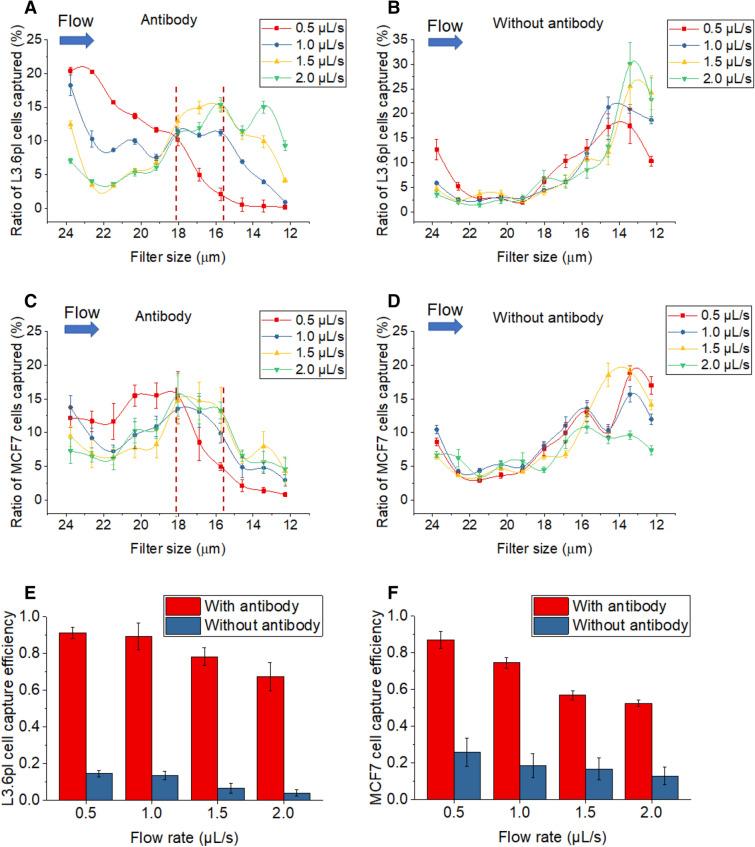
Figure 4.
(A) The ratio of L3.6pl cells captured along different filter zones in the LFAM2 device immobilized with antibodies, under different flow rates. The vertical dotted lines indicate the filter zones with high cell capture. (B) Same as A except in the device without antibody immobilized. (C) Same as A except MCF7 cells were used. (D) Same as (C) except in the device without antibody immobilized. (E) L3.6pl cell capture efficiency in the LFAM2 device as a function of the flow rate. (F) Same as (E) except for MCF7 cells.

