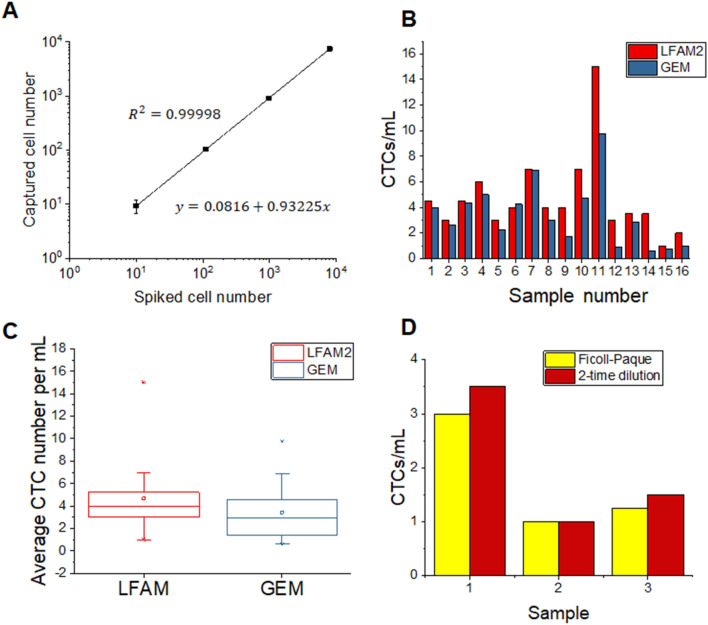
Figure 6.
(A) Calibration curve between the number of L3.6pl cells captured in the LFAM2 device and the number of cells spiked in healthy blood. (B) CTCs per mL of blood samples from cancer patients, enumerated using either LFAM2 or GEM. (C) Box plots of the results in (B) with the average and range of CTCs per mL. (D) Comparison between two blood preparation methods, Ficoll-Paque and 2-time diluted whole blood, prior to infusion into LFAM2.

