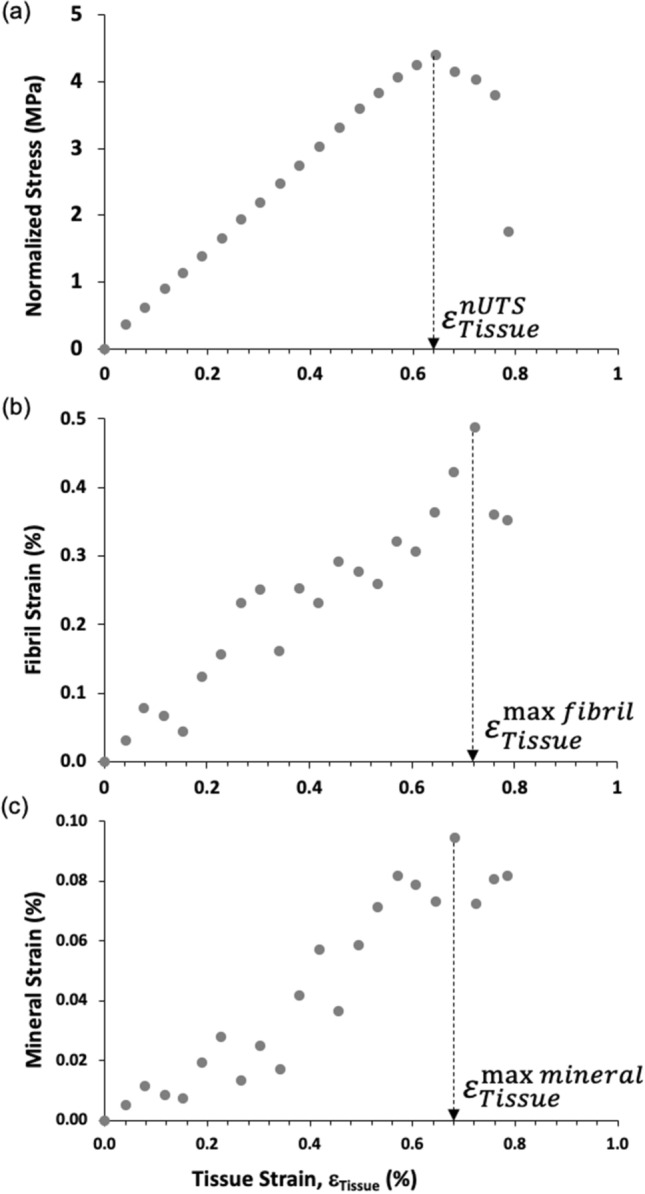
Figure 2.

Local displacement curves for a single typical bone sample. (a) Macroscale stress–strain curve indicating the macroscale property of critical tissue strain (). (b) Nanoscale fibril-tissue strain curve showing tissue strains to reach the nanoscale property of peak fibril strain (). (c) Nanoscale mineral-tissue strain curve showing the tissue strains to reach the nanoscale property of peak mineral strain (). Tissue strain is plotted along the x-axis in all three figures allowing a comparison of the occurrence of key events (the peaks) from the nanoscale to the macroscale.
