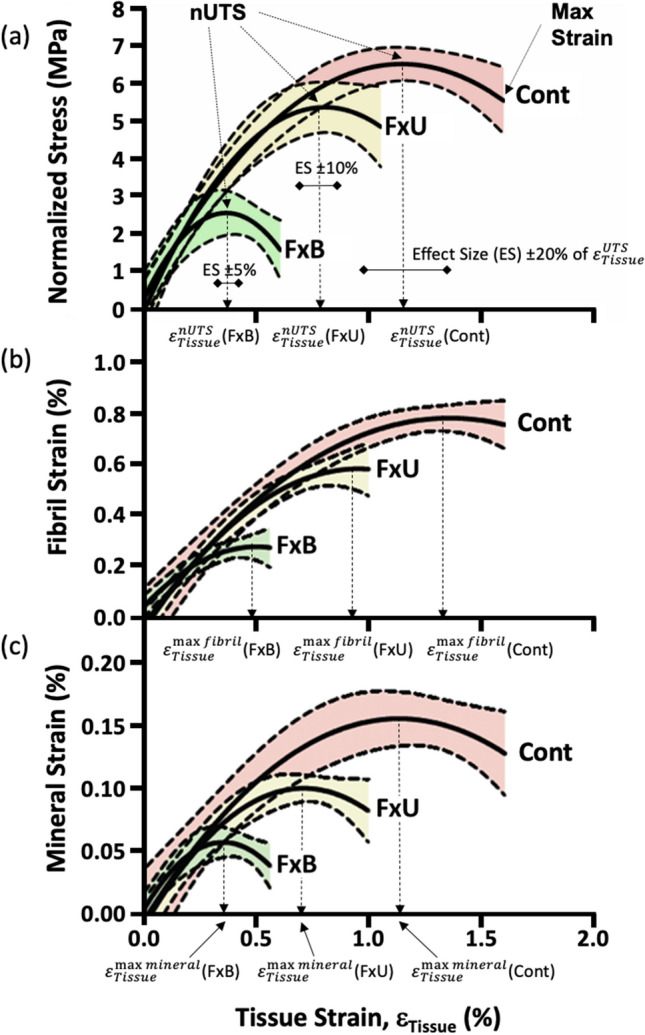
Figure 3.

Overall stress and strain curves for Control, Fx-Untreated and Fx-BisTreated groups. (a) Normalized stress–strain curves indicating the critical () and max tissue strains for each group. Effect sizes (ES) used in the statistical analyses are shown (see Table 2). (b) Fibril-tissue strain curves showing tissue strains to reach peak fibril strain (). (c) Mineral-tissue strain curves showing the tissue strains to reach peak mineral strain (). Shaded areas represent the 95% confidence intervals for n = 10 donors per group.
