Figure 5.
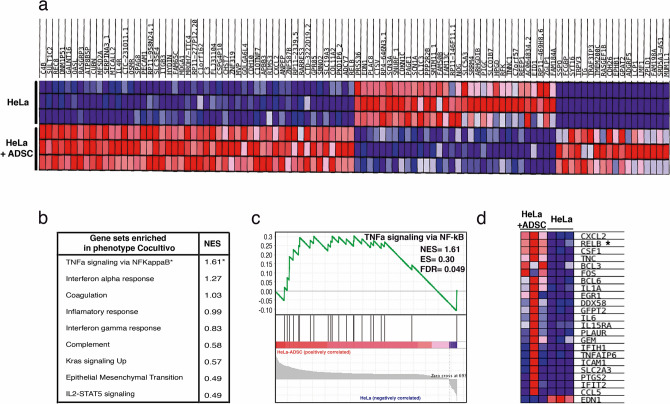
The NF-Kappa B pathway is the most activated pathway during the coculture of HeLa-ADSC. (a) Heat map shows the main differentially expressed genes in the HeLa cell line cultured in the presence or absence of ADSC. The expression values are represented as colors, where the range of colors (red, pink, light blue, dark blue) represents the range of expression values (high, moderate, low, lowest). (b) Table shows the main phenotypes enriched in HeLa cells due to the presence of ADSCs obtained from a gene set enrichment analysis (GSEA). For each of the phenotypes, the normalized enrichment score (NES) is indicated. (c) Analysis of GSEA showing significant enrichment (NES = 1.61 and an FDR = 0.049) of the TNFα-NF-kappa B signaling pathway in cervical cancer cells due to the presence of ADSCs. (d) The heat map shows the subset of enriched genes involved in the TNFα-NF-kappa B pathway, where most deregulated genes are involved in the noncanonical NF-Kappa B pathway, such as RELB.

