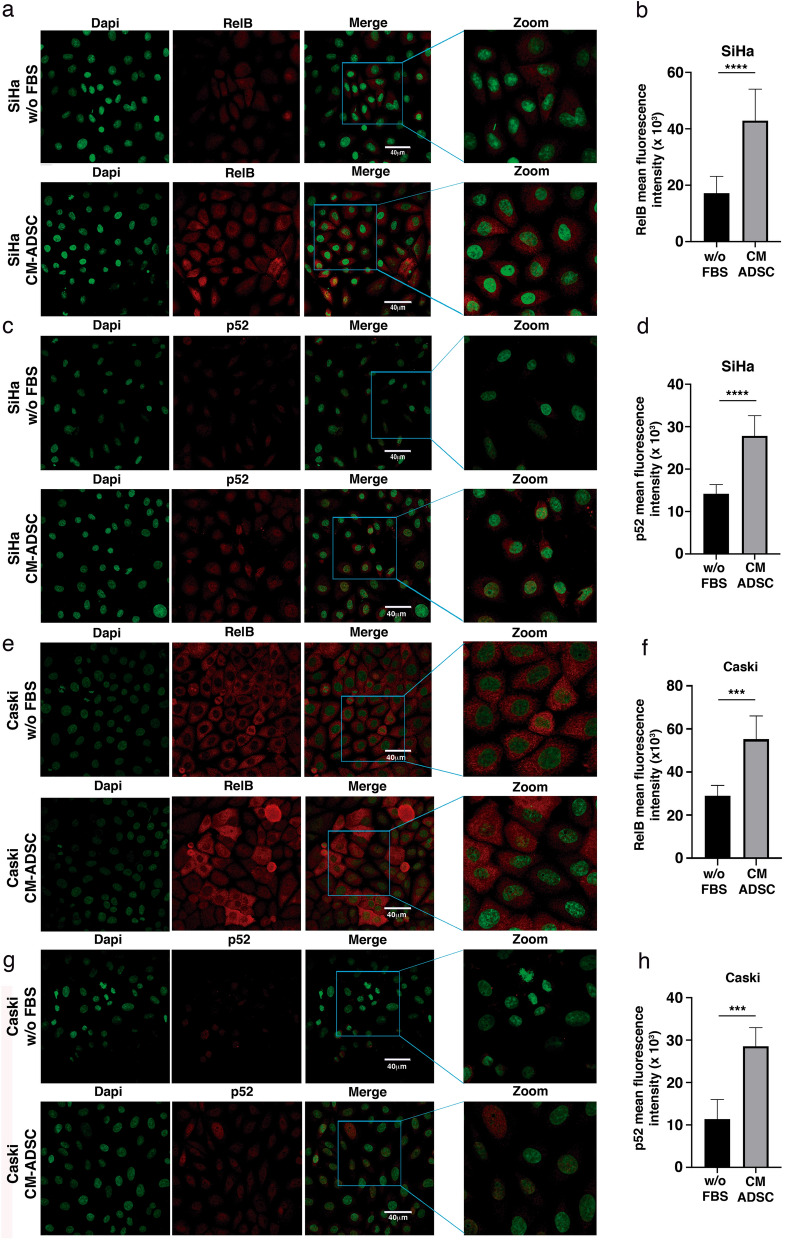
Figure 7.
ADSC induces the activation of the NF-kappa B pathway in SiHa and CaSki cells. (a–h) The photographs show the expression of RelB and p52 obtained by immunofluorescence of SiHa (a–c) or CaSki (e–g) cells cultured with serum-free DMEM or ADSC-CM (free of serum) for 24 h. The images were taken under a confocal microscope. The scale bar = 40 μm. The cell nuclei were contrasted with DAPI. Each experiment was repeated at least three times. To quantify the expression levels, the intensity of fluorescence was quantified using Image J. Graphs show the mean fluorescence intensity of RelB (b), p52 (d) in SiHa and Relb (f) and p52 (h) in Caski cells. Graph represents three biological replicates, error bars are s.d. and ****p < 0.0001 and *** p < 0.001.

