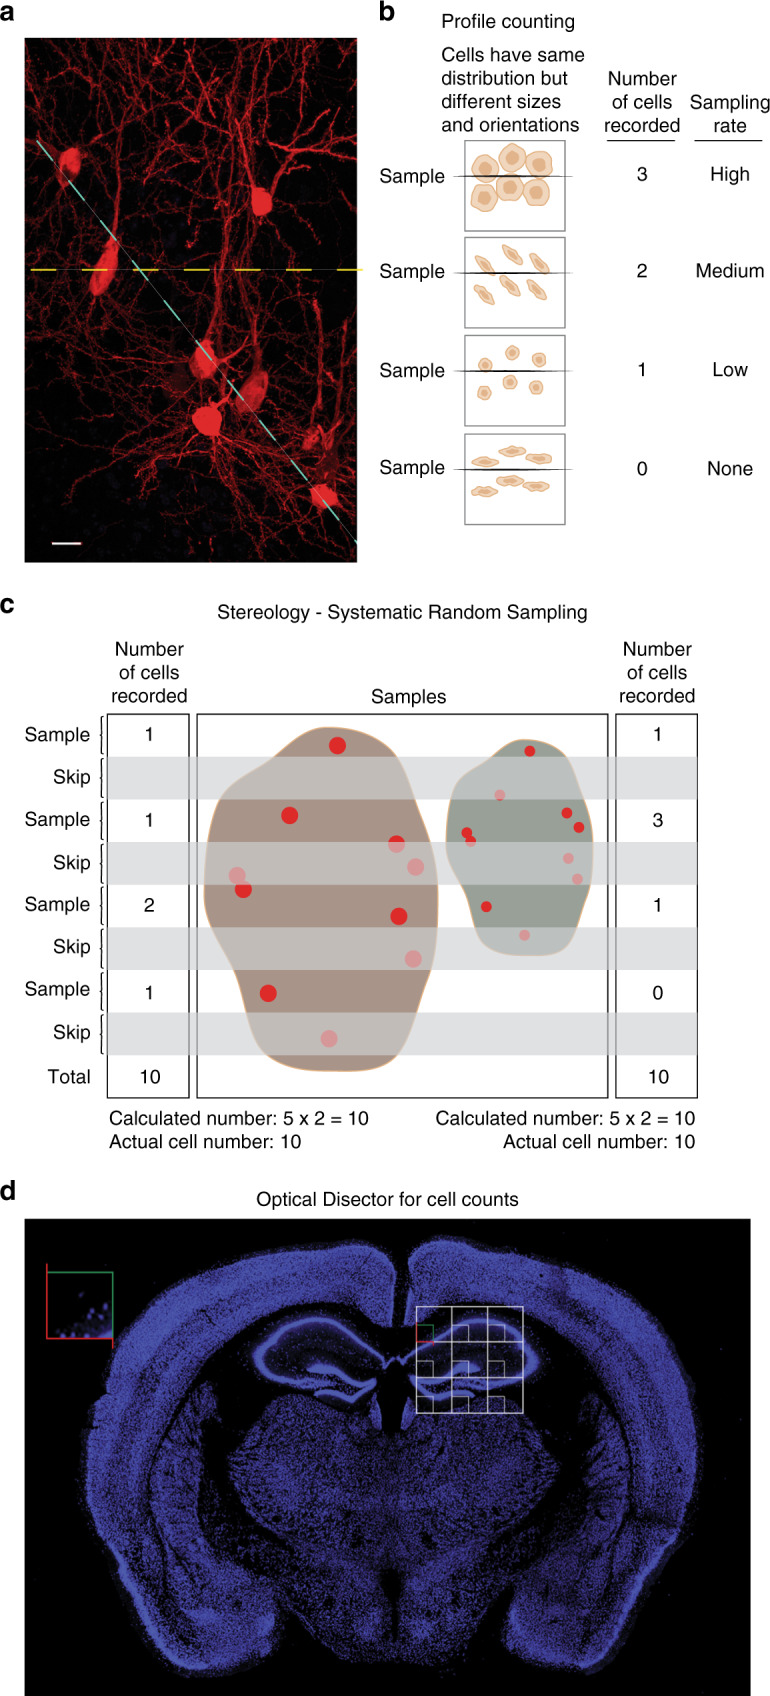
Fig. 2. The benefit of using design-based stereology with random sampling to quantify cells.

a Photomicrograph of entorhinal cortex neurons with variable shapes and uneven distribution. The image was derived from a C57Bl/6 mouse injected into the DG with rabies virus expressing mCherry, as a retrograde tracer11 (40 μm horizontal section). Scale bar, 10 μm. The dotted lines illustrate two different potential focal planes for microscopic visualization with different cell numbers. b. Schematic illustration showing that cell profile counting, using a ‘representative” thin section (dark line) of tissue, is heavily influenced by the size and orientation of the cells of interest. In a thin section, a larger cell (top sample) has more chances to be represented and therefore counted than a smaller cell (third sample from top). The orientation of cells that are not round can significantly change the outcome of the counting, as illustrated by the second sample (2 cells are counted) versus the fourth sample (no cell is counted). The results of profile counting may not reflect the actual cell number. c Schematic illustration showing that design-based stereology with serial randomized sampling throughout the entire three-dimensional tissue (example shows 1 in 2; ssf = 1/2) yields more accurate counts. The tissues on the left and right both have 10 cells. Despite the differences in size of the tissues and cells, the results are close to the actual cell numbers. d Cell quantification using the optical disector. A sampling grid (white) overlays the region of interest (ROI) for quantification, the hippocampus. The intersections of the grid within the ROI define the position of the counting frames (red and green) at which the sections are probed at high magnification. The cells within the volume of the tissue in each 3-D optical disector probe are counted if they do not touch any surface or the green surface, whereas those that touch red are not included. Photomicrograph of a 40 μm coronal section through the mouse brain labeled with NeuN (blue).
