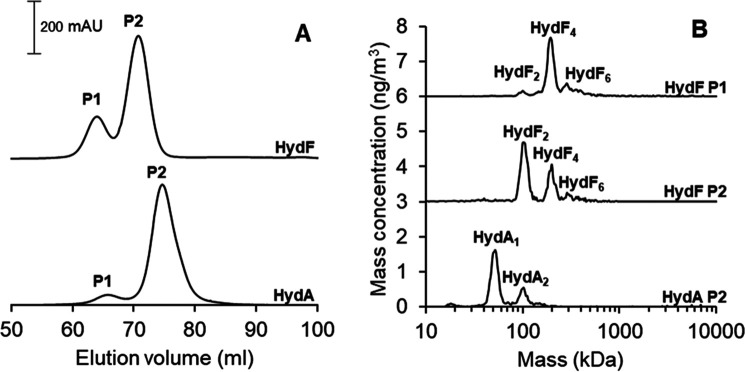
Figure 2.
A, SEC chromatograms of the apo-HydF (top) and apo-HydA1 (bottom). Running conditions were 0.8 ml/min flowrate, 50 mm Tris-HCl, pH 8.0, 150 mm NaCl. B, the corresponding GEMMA spectra recorded for the different fractions of the apo-HydF and apo-HydA1 proteins obtained from SEC. Running conditions were 0.02 µg/µl protein in 20 mm ammonium acetate and 0.005% Tween 20.

