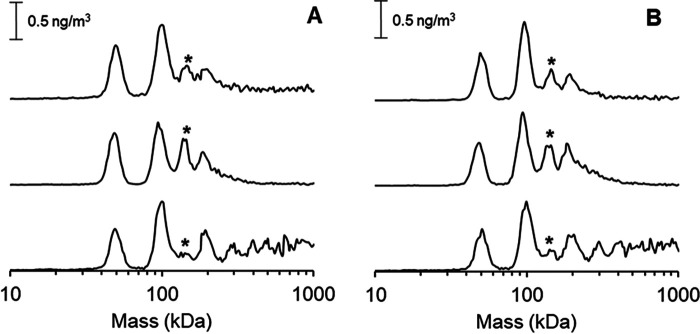
Figure 4.
GEMMA spectra recorded on combinations of HydF and HydA1 proteins with different cofactor content. A, apo-HydA1 interaction with different cofactor containing forms of HydF (top, holo-HydF; middle, [4Fe4S]-HydF; bottom, apo-HydF). B, [4Fe4S]-HydA1 interaction with different cofactor containing forms of HydF (top, holo-HydF; middle, [4Fe4S]-HydF; bottom, apo-HydF). The 150-kDa peak representing the HydF2–HydA1 interaction complex is indicated with an asterisk. The experiments were performed with 0.02 µg/µl each protein (total protein concentration, 0.04 µg/µl) in 20 mm ammonium acetate and 0.005% Tween-20.

