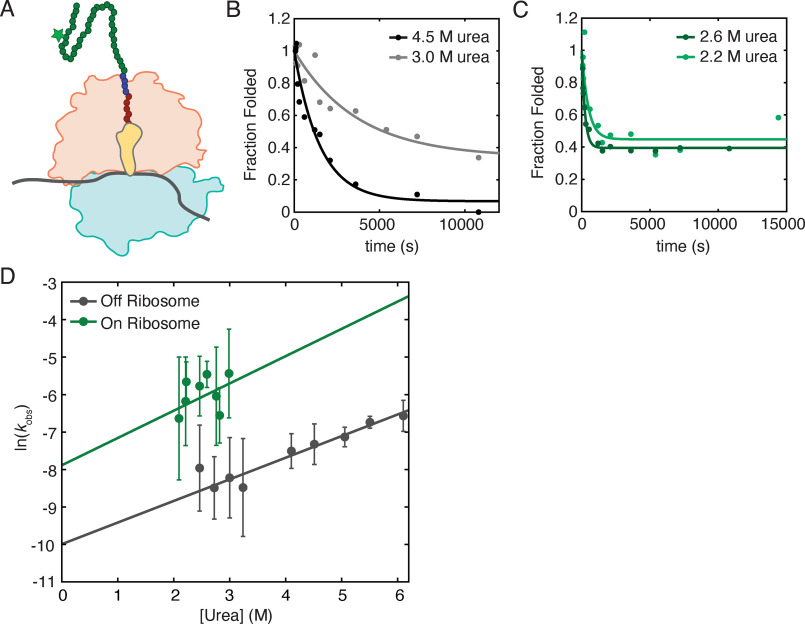
Figure 2.
Unfolding kinetics as measured by pulse proteolysis. A, cartoon representation of a ribosome-stalled nascent chain generated for pulse proteolysis experiments. A 50S subunit (orange) and 30S subunit (light blue) with a peptidyl-tRNA (yellow) stalls during translation of mRNA (gray) at a SecM stall sequence (red circles). The protein of interest (green circles) is extended beyond the ribosome exit tunnel by a 10-residue glycine–serine linker (blue circles). The nascent chain is tagged with a BODIPY-FL-Lysine (star). B, representative traces of observed off-ribosome unfolding rates of RNH I53D at 4.5 m urea (black) and 3.0 m urea (gray). C, representative traces of observed on-ribosome unfolding rates of RNH I53D at 2.6 m urea (dark green) and 2.2 m urea (light green). D, data sets including B and C are fit to a single exponential to extract kobs, and the ln(kobs) for experiments on (green) and off the ribosome (gray) are plotted at several urea concentrations. Error bars are the 95% confidence interval of the fits to a single exponential at each urea concentration. These data are fit to a linear model weighted for the error at each point where the slope is , and the y intercept is , the unfolding rate in a 0 m denaturant condition. The urea concentrations at which we can investigate the unfolding rates of nascent chains are limited based on the Cm of the nascent chain and the stability of 70S ribosomes, leading to a higher error for the extrapolation of on-ribosome data.

