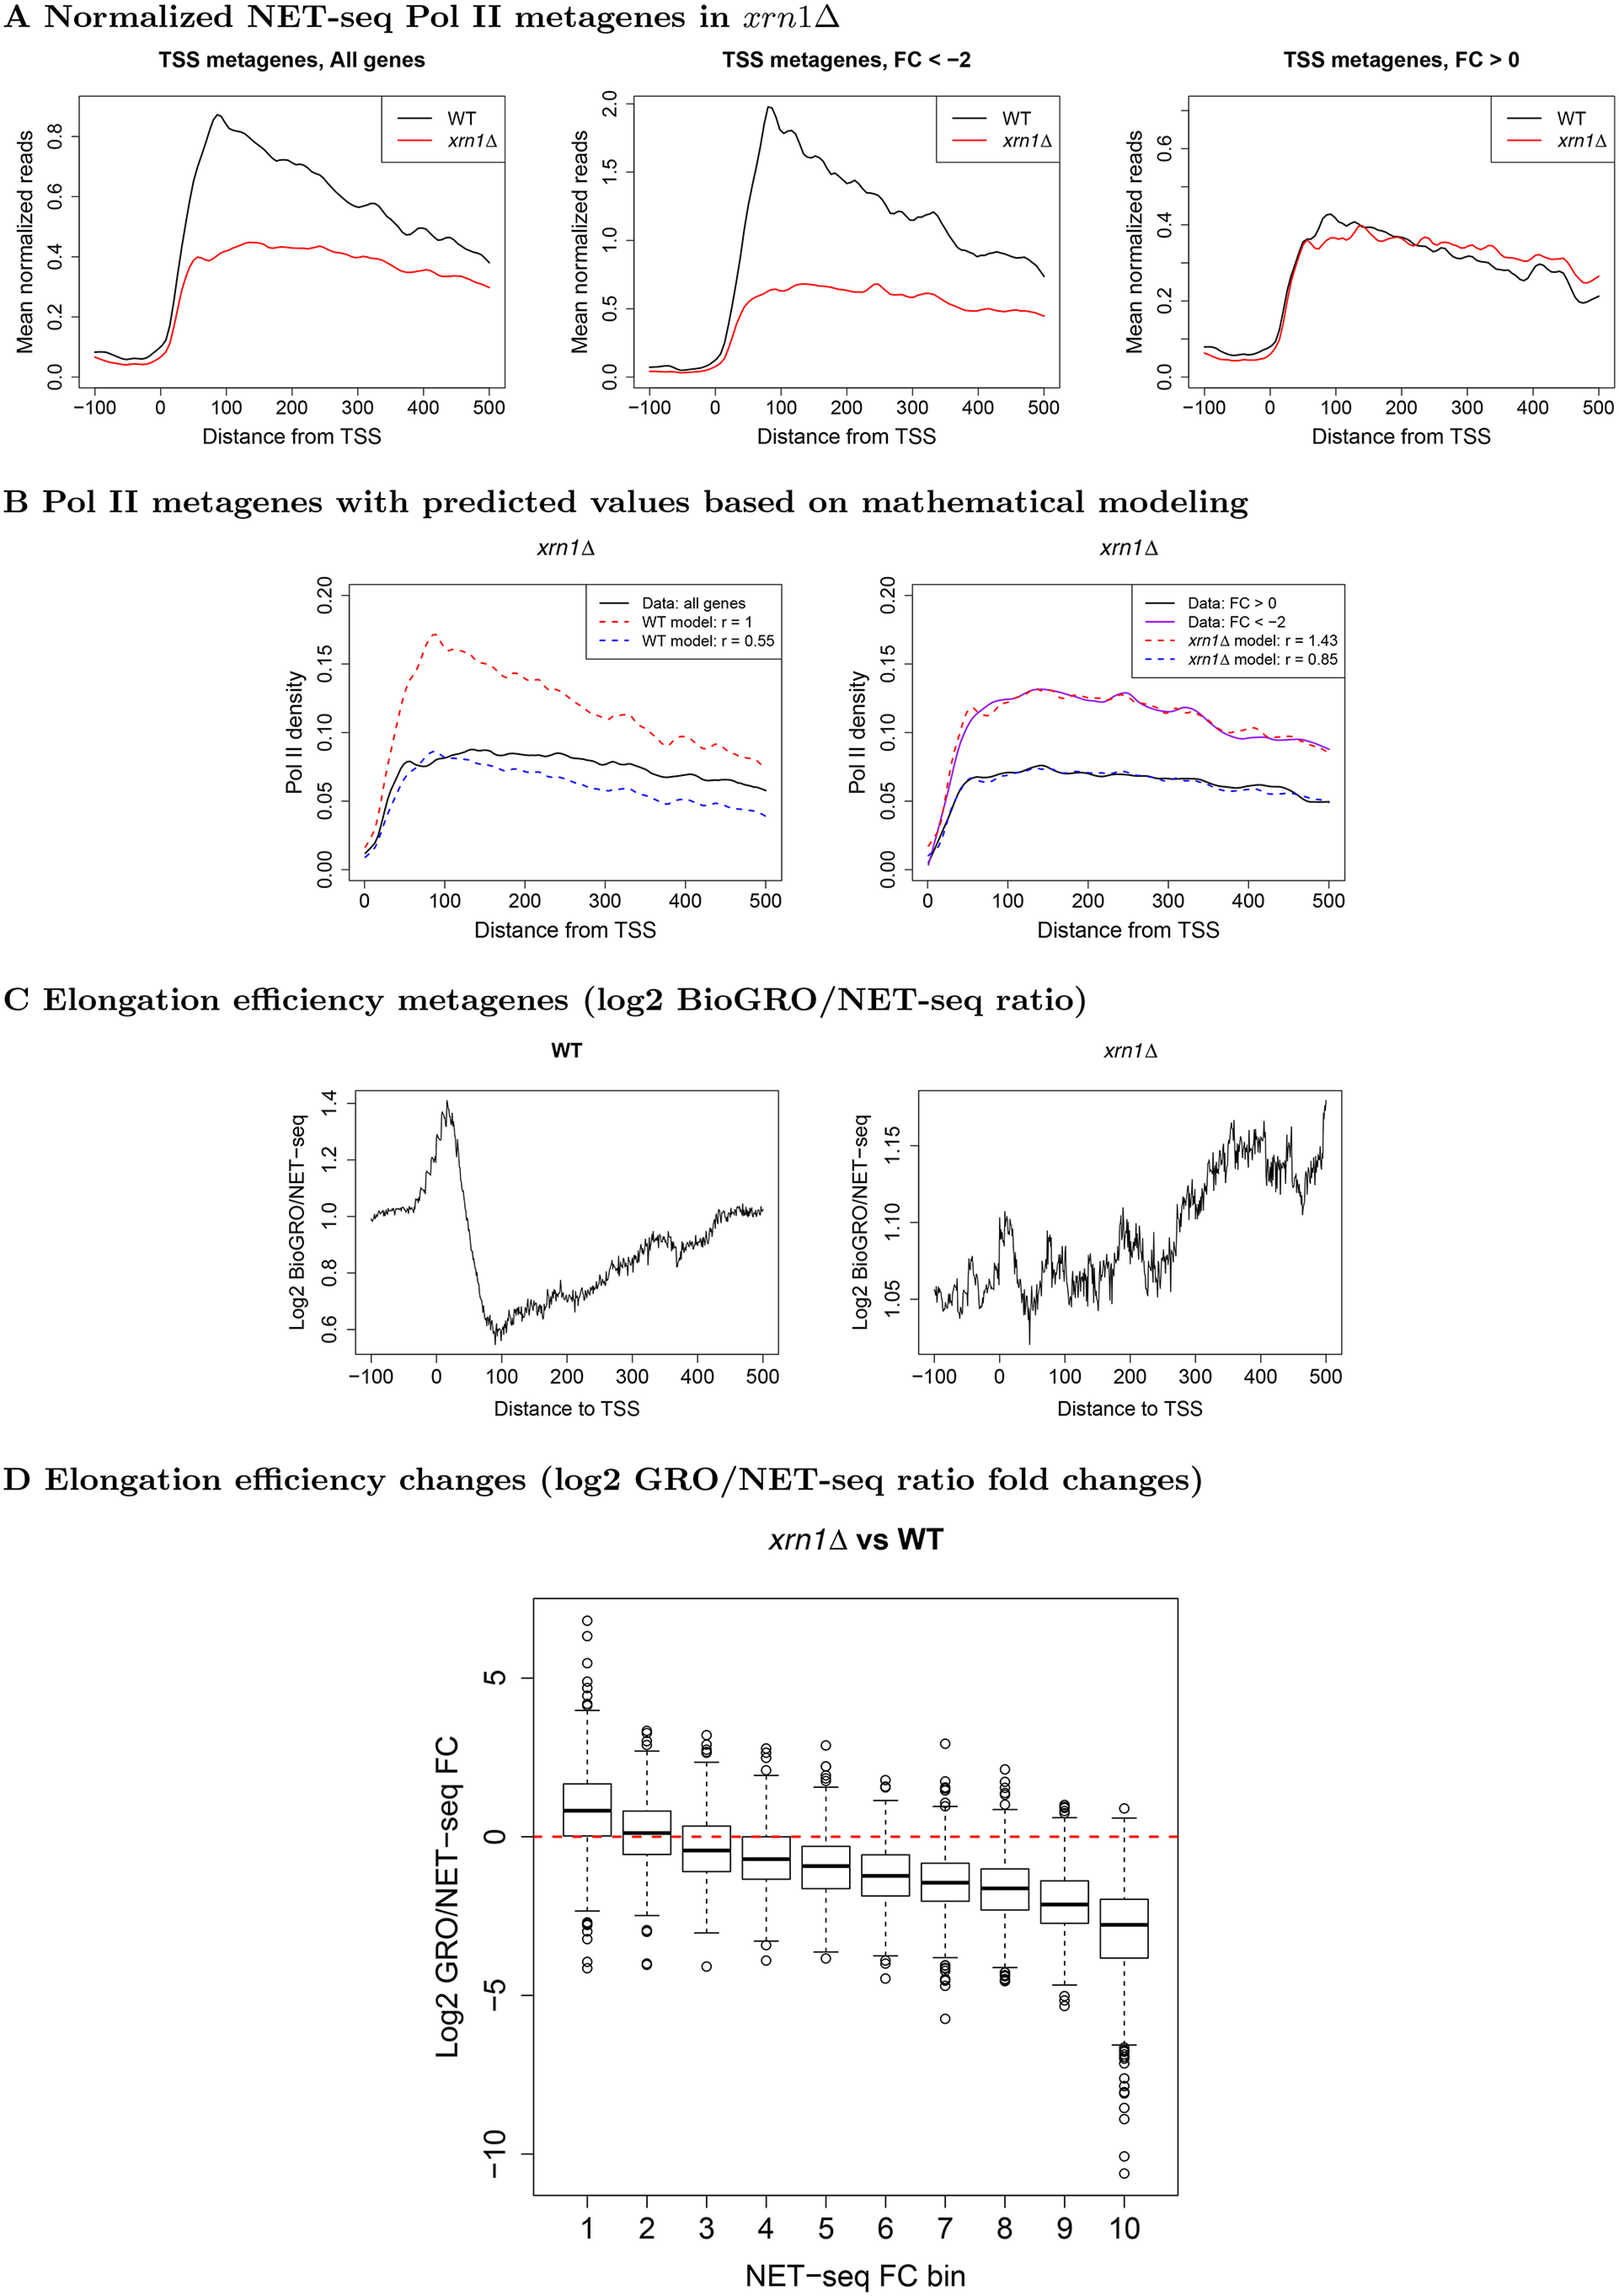
Figure 3.

Metagene profiles near TSS in WT and xrn1Δ for Pol II and BioGRO/NET-seq ratios. A, we extracted NET-seq reads (–100:500 relative to TSS), normalized, and averaged them. Genes were separated into those which are stimulated (FC < 2) or repressed by Xrn1 (FC > 0). Note that the axes are on different scales to facilitate comparison of profile shapes within each panel. B, we applied a mathematical model (see “Materials and methods”) to investigate how initiation and elongation rates affect metagenes. Elongation rates for WT and mutant metagenes were estimated and initiation rates (r) were varied to find the best fits. L, varying initiation rates while using only the estimated WT elongation rates; R, varying initiation rates while using the estimated elongation rates from the xrn1Δ metagene. See Fig. S8 for other mutants. C, we extracted BioGRO and NET-seq values in the −100:500 region with respect to the TSS for all genes. For each gene, we smoothed the BioGRO and NET-seq profiles and took the log2 of their ratios. We then averaged over all genes to yield elongation efficiency metagenes. The profile shapes should be compared rather than the raw values due to potential differences in the scales of the BioGRO data. D, comparison of fold changes in elongation efficiency as a function of fold changes in NET-seq Pol II occupancy in xrn1Δ cells in the first 500 bp downstream of TSS. Genes were sorted into bins such that those in bin 1 had the largest reductions in occupancy, whereas those in bin 10 had slight increases. See “Materials and methods” for more details.
