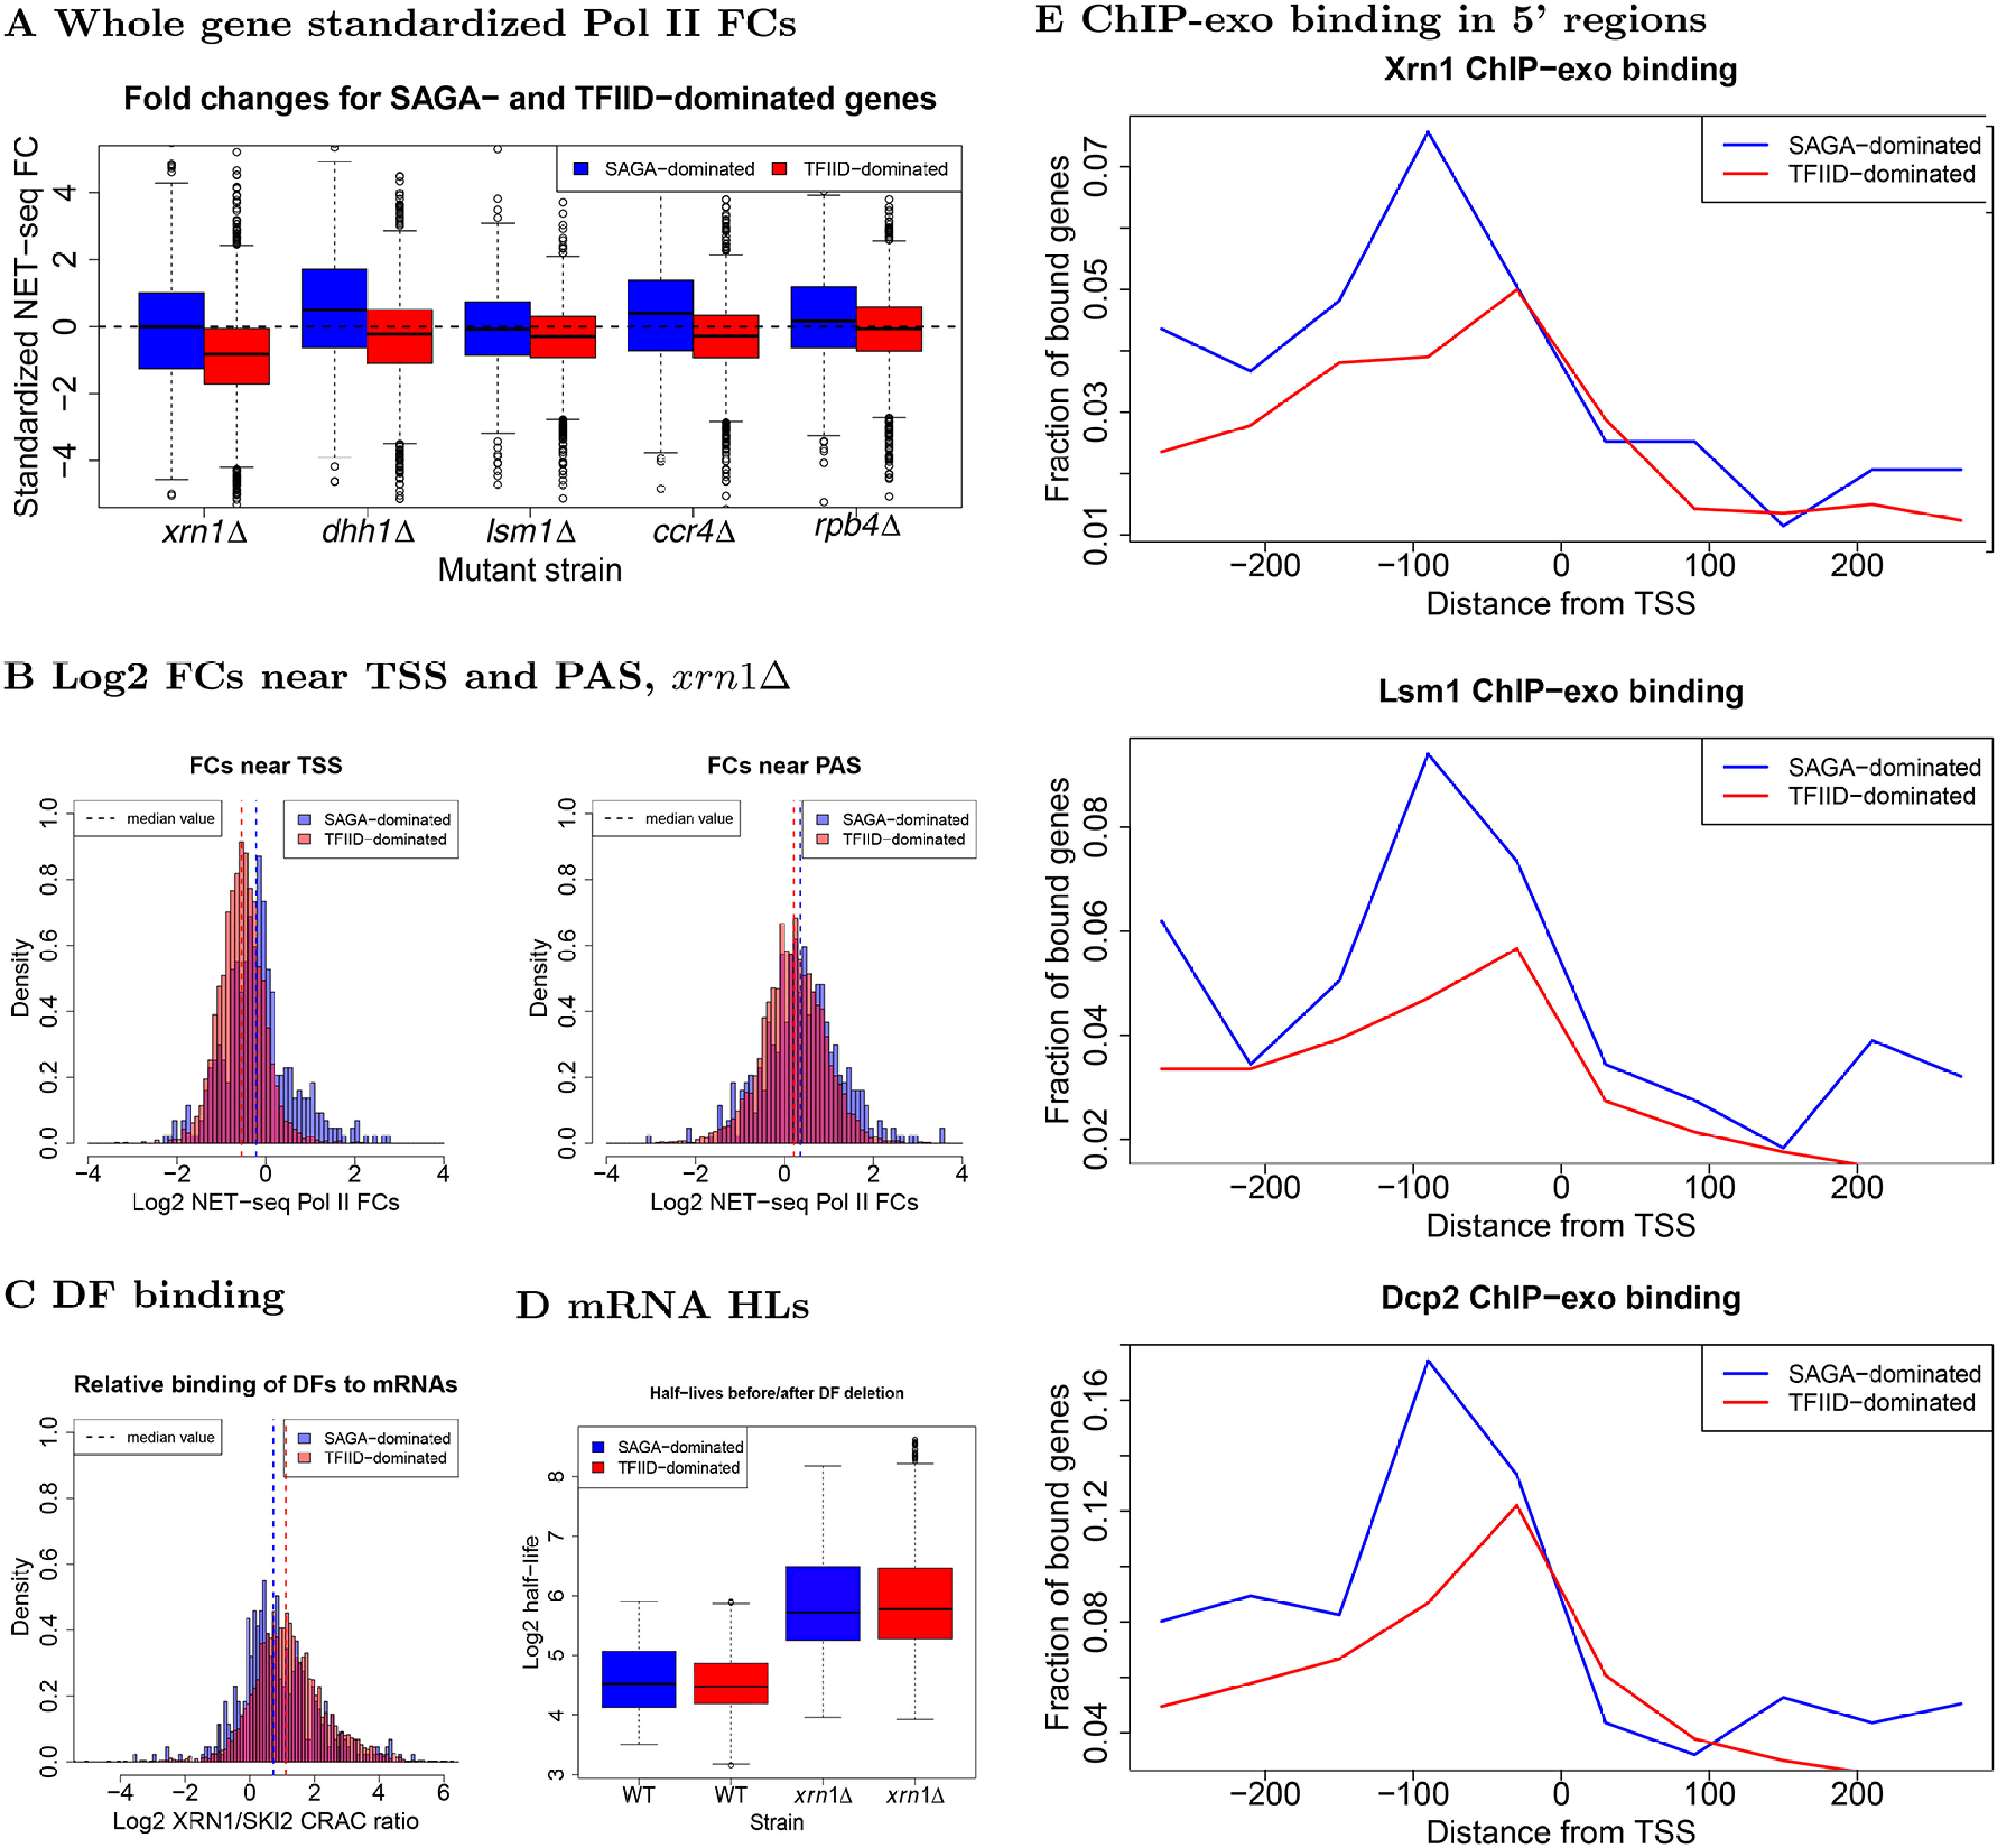
Figure 7.

Comparison of transcription, decay, and protein binding for SAGA- and TFIID-dominated genes. A, fold changes, computed as described in the legend to Fig. 1A, for SAGA- or TFIID-dominated genes, as indicated. B, histograms of log2 NET-seq Pol II FCs for regions near TSS (−100:500) and PAS (−150:150) in xrn1Δ. C, we summed Xrn1 and Ski2 CRAC data (60) mapped to each gene and took the log2 ratio of mapped reads for each DF in each gene. D, comparison of mRNA half-lives before and after XRN1 deletion (2). E, reads were binned into windows of 60 bp starting 300 bp upstream and extending 300 bp downstream of TSS. The proportion of bins having more than 10 recorded reads was then computed across the genome and plotted (1). Due to coverage differences across the Xrn1, Lsm1, and Dcp2 experiments, only the qualitative behavior between different panels should compared. Within panels, the fractions may be compared without worry.
