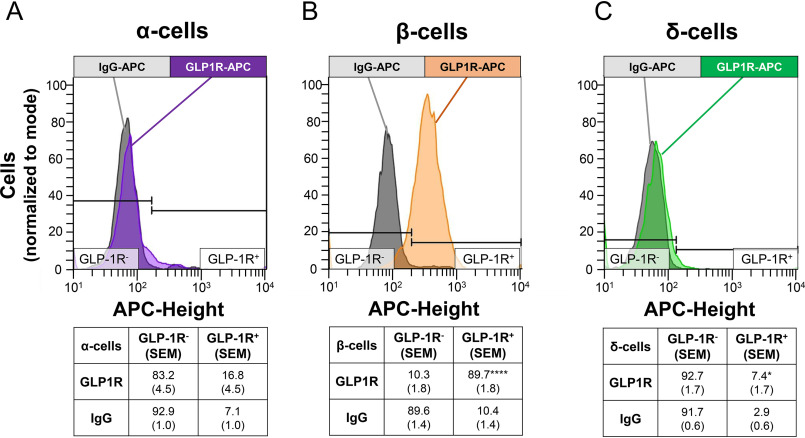
Figure 6.
GLP-1R staining is robust in enriched β-cells by flow cytometry. A, GLP1R-APC staining in α-cells (purple) did not reach statistical significance (p = 0.07). B, β-cells had robust GLP1R-APC staining (orange). C, δ-cells had a slightly greater GLP1R-APC staining (green) than IgG-APC control. Representative histograms of staining in α-, β-, and δ-cells are shown with IgG-APC (gray) displayed for each cell type. Population statistics are reported below histograms as a percentage of enriched cells (S.E.). n = 7 experiments. ****, p < 0.0001; *, p < 0.05, paired t test.

