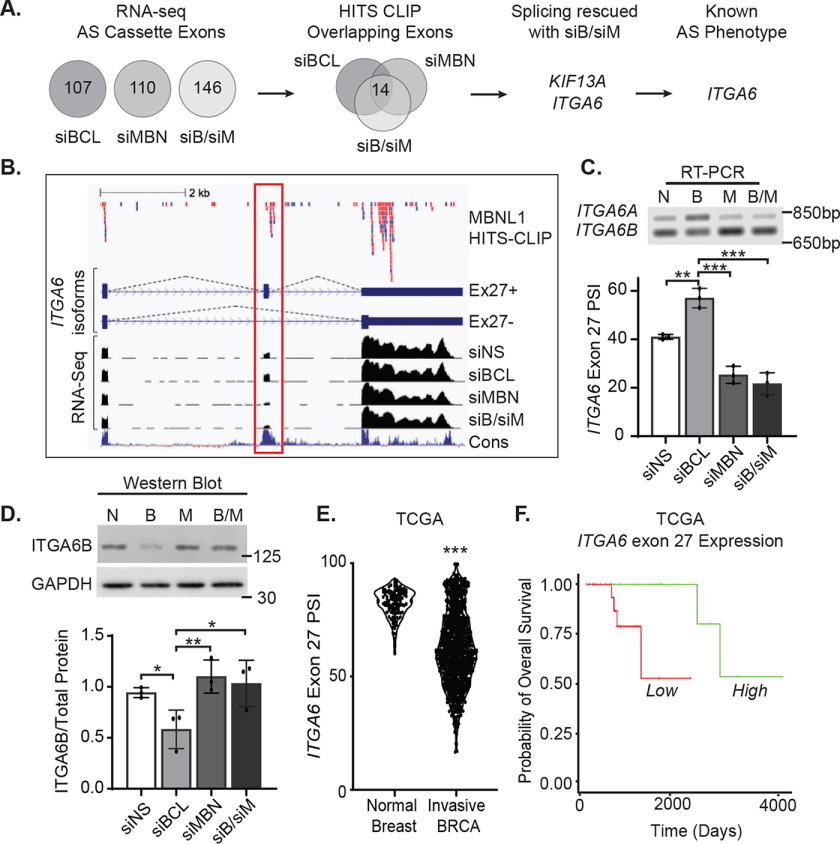
Figure 5.
BCL11A increases expression of the ITGA6B stem-like splice form. A, alternatively spliced (AS) cassette exons identified using RNA-Seq of MDA-MB-231 cells after transiently silencing BCL11A, MBNL1, or both were intersected with HITS-CLIP data for MBNL1-bound transcripts (37). AS events induced by BCL11A silencing that were then reversed by cosuppression of MBNL1 were selected as candidates for further analysis. B, top, CLIP reads from MBNL1-binding libraries; library 1, red; library 2, blue. Middle, diagram of AS ITGA6 isoforms ± exon 27 (red outline). Bottom, corresponding RNA-Seq tracks for each siRNA condition and conservation across species (Cons, blue). C, top, representative agarose gel image examining changes in the expression of ITGA6 exon 27 AS isoforms following silencing of BCL11A, MBNL1, or both in MDA-MB-231 cells using RT-PCR. Bottom, quantitation of ITGA6 AS in 3 independent experiments, each performed in either duplicate or triplicate. D, top, representative western blot assessing changes in the levels of the ITGA6 stem-like splice form (ITGA6B) that occur with changes in BCL11A, MBNL1, or both. Bottom, quantitation of protein expression of the ITGA6B splice form from 3 independent experiments, each performed in either singlet or duplicate. E, PSI for ITGA6 exon 27 was obtained from the TCGA data set for normal breast, n = 114 or invasive BRCA, n = 1081. Significance of differences was calculated for panels C–E using an unpaired t test. F, ITGA6 exon 27 expression in basal breast cancers from the TCGA data set were stratified into groups with high expression (upper 15th percentile, n = 25) and low expression (remaining 85th percentile, n = 24) and overall survival compared by log-rank test, p = 0.005, HR = 0.148. *, p < 0.05; **, p < 0.01; ***, p < 0.001.

