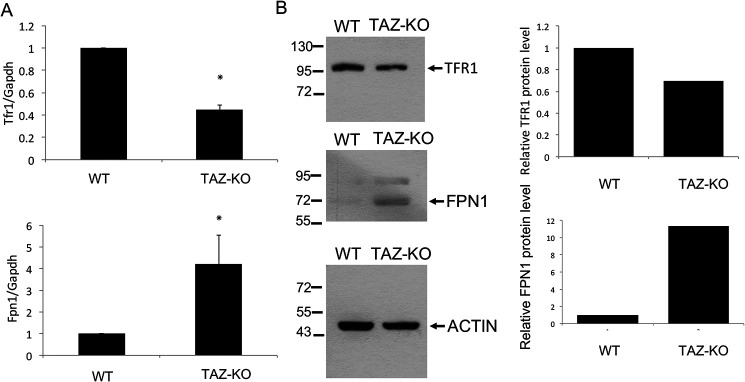
Figure 2.
TAZ-KO cells exhibit altered expression of genes for iron transport. A, mRNA levels of iron transport genes TFR1 and FPN1 from WT and TAZ-KO cells were quantified by qPCR. The values are reported as fold change in expression in mutant relative to WT. Expression was normalized to the mRNA levels of the internal control GAPDH. The data shown are means ± S.D. (n = 3). *, p < 0.05. B, Western blotting analysis of FPN1 and TFR1 from total extracts of mouse cells grown to 100% confluency. ACTIN is included as a loading control. The signal intensities of protein bands and surrounding background were scanned and quantified using ImageJ. The background-subtracted value for each protein band was normalized to that of ACTIN and quantified relative to WT.

