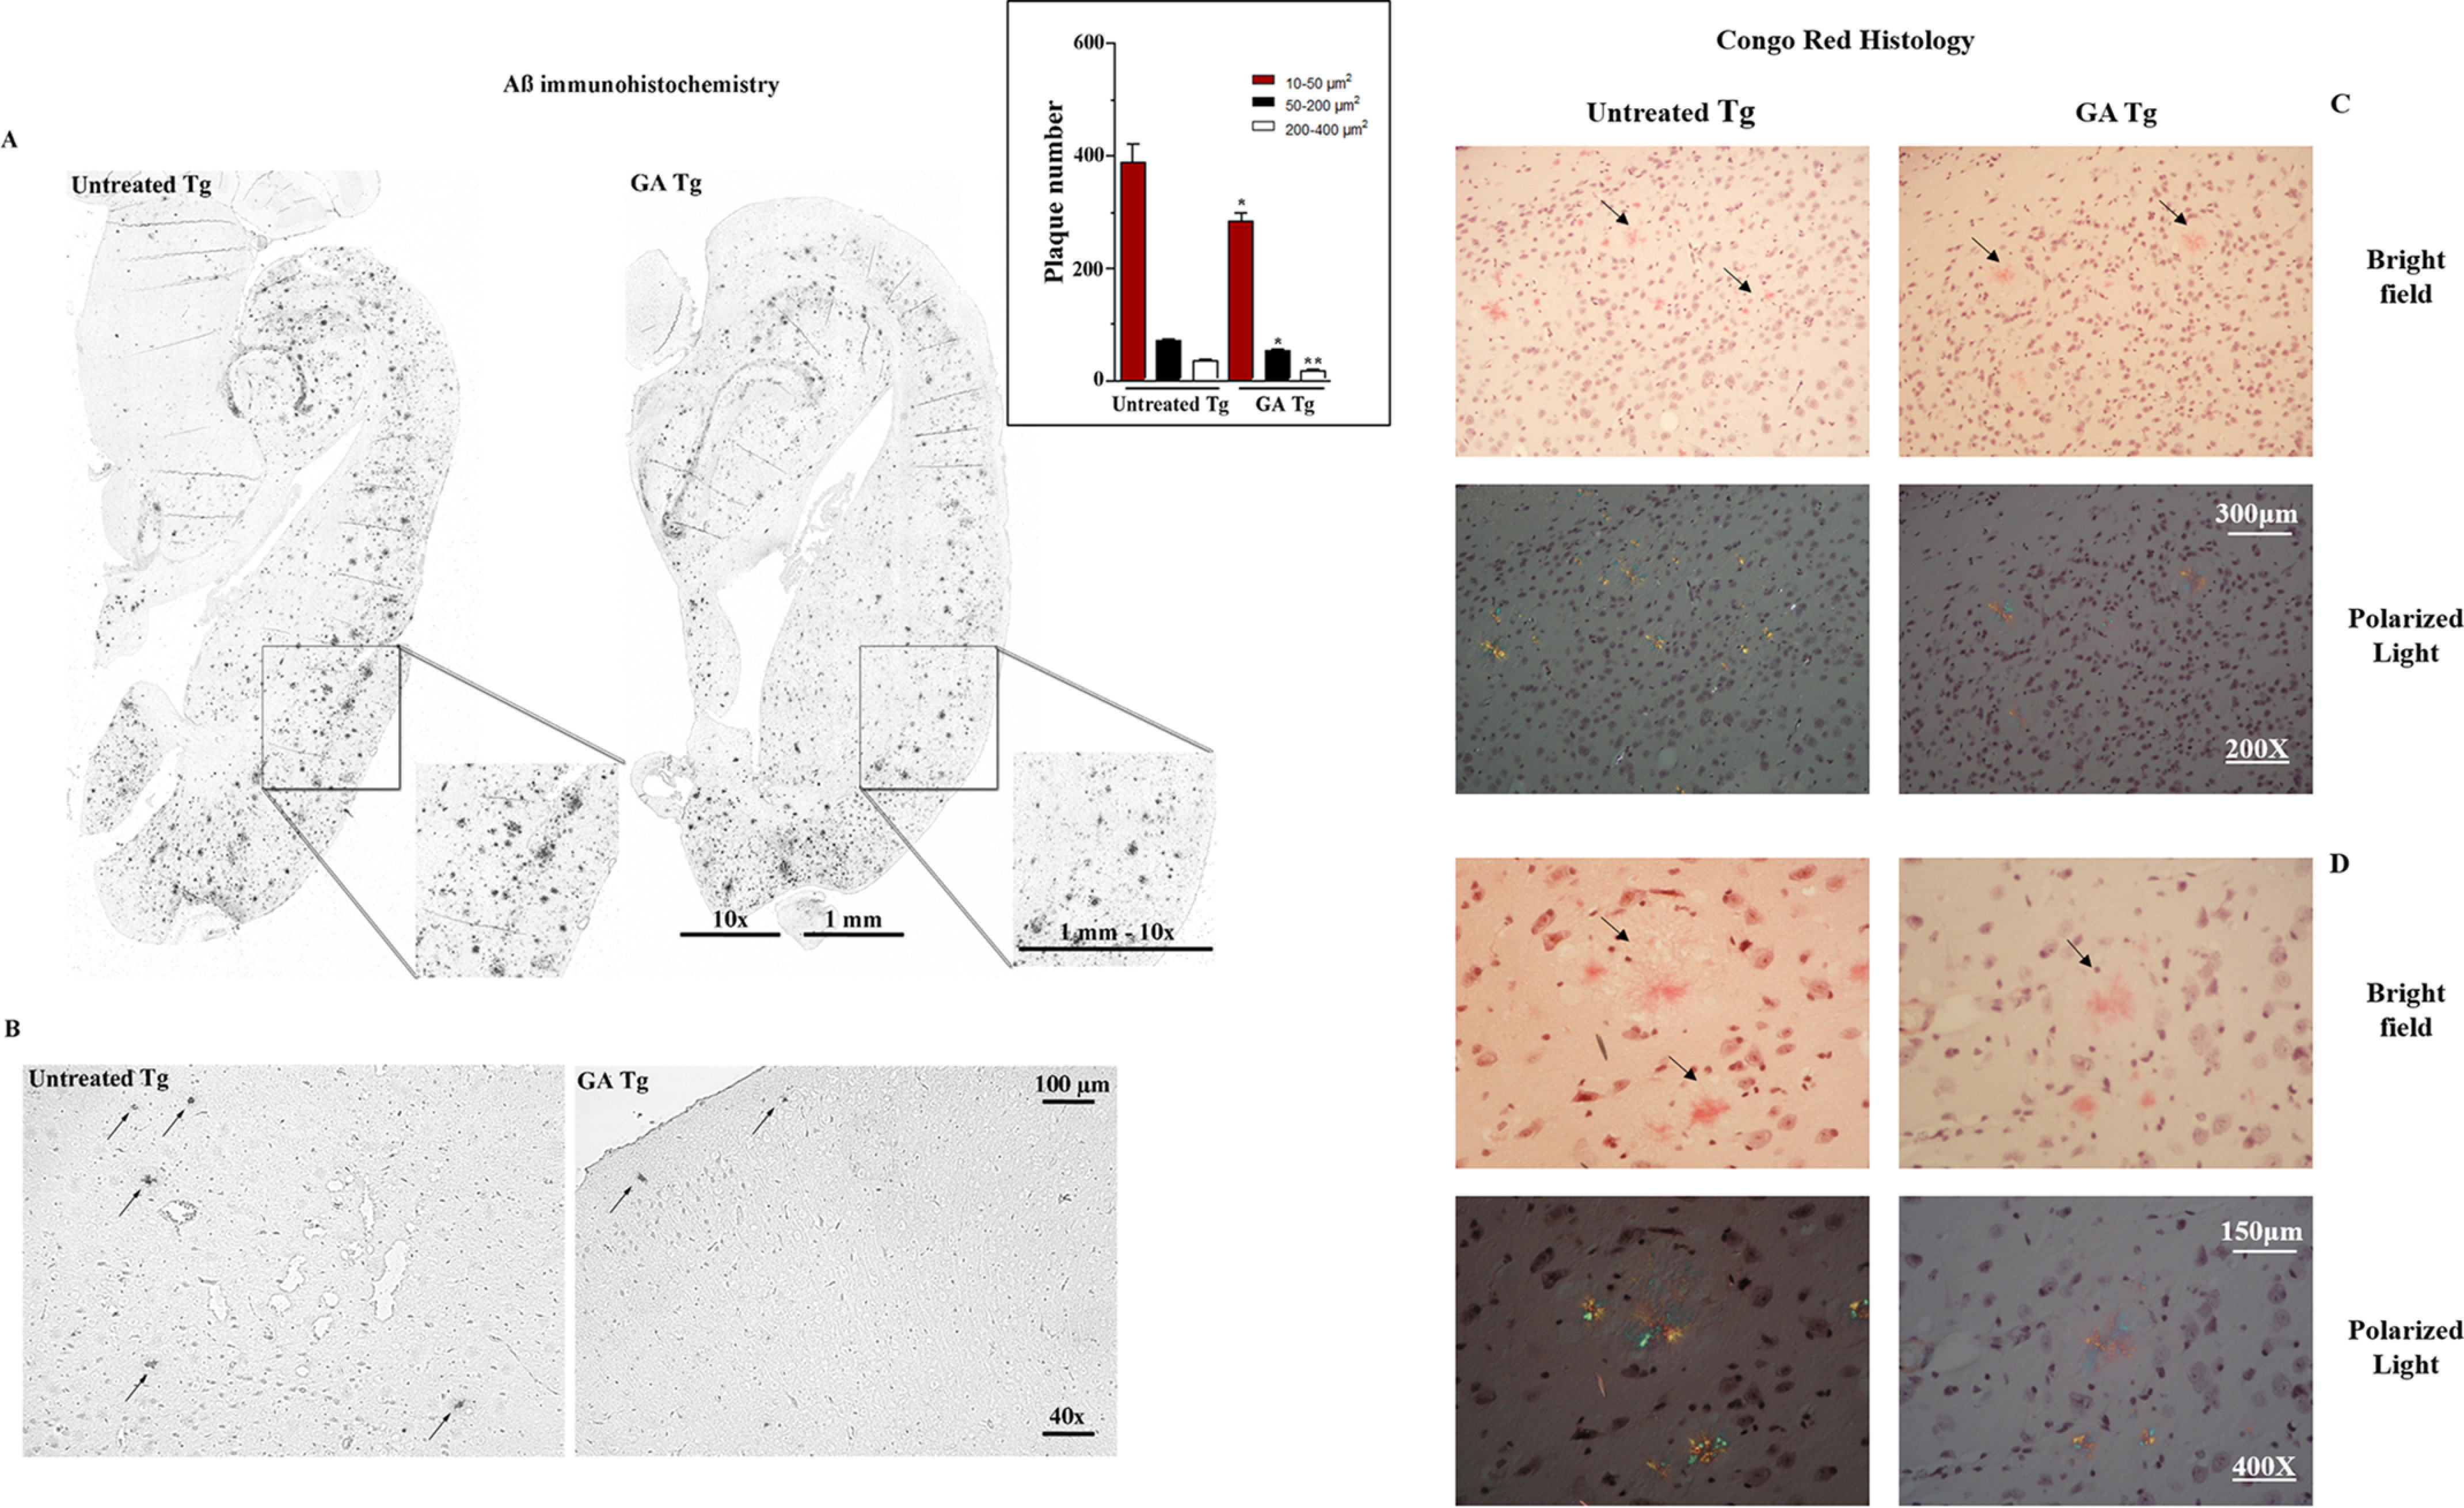
Figure 4.

Effect of GA on Αβ aggregate formation in the brain of TgCRND8 mice. IHC analysis of pyroglutamate-3 Aβ (pE3 -Aβ) (A and B) and Congo Red histology (C and D) of entire hemibrain sections were performed in TgCRND8 mice after 10-day oral administration of GA (200 mg/kg; Tg+GA group) or vehicle (olive oil; Tg group). Control images of Congo Red staining are reported under Fig. S5. Other details on these animal experiments are reported under “Experimental Procedures.” Insert to panel A: bar chart of Aβ plaque number in the entire hemisphere of 14-15-month–old Tg mice; plaque number was determined automatically on digitized images using the CellSens Dimension software (Olympus, Germany); **, p< 0.005 and *, p< 0.05 versus respective area size of untreated Tg.
