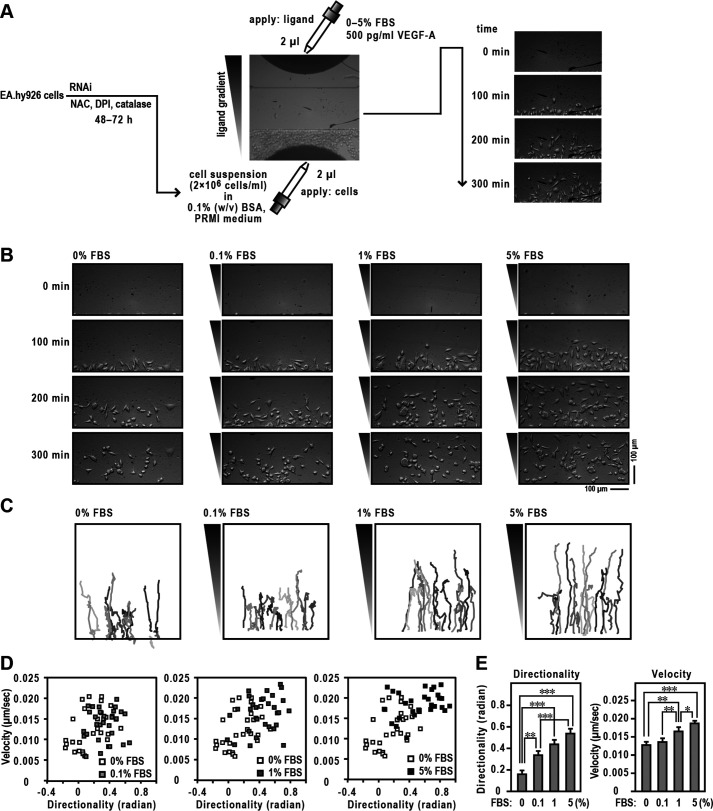
Figure 1.
Migration of ECs in TAXIScan. A, schematic illustration of the experiment. See Experimental procedures for details. B, images of ECs migrating toward FBS in TAXIScan channels. The concentration of injected FBS and their gradient are indicated schematically on the left axis. The distance between the start line (bottom) and finish line (top) of each channel is 260 μm. Scale bar, 100 μm. C, trajectory patterns of ECs migrating toward FBS. The images of migrating cells in TAXIScan channels were filmed, and their paths were traced. Each point shows the direction and distance of each cell in 5 min, from which the mean values of directionality and velocity were calculated. Traces in different colors indicate an independent cell migration. D, velocity–directionality (VD) plots of EC migration. The methods used to calculate each value are described in Experimental procedures. Representative VD plots obtained from 0% FBS and each concentration in panel B are shown. E, statistical analysis of the data of panel D. Each graph represents the mean ± S.D. of pooled data of migrating cells (n ≥ 30) from three independent experiments: *, p < 0.05; **, p < 0.01; ***, p < 0.001. Statistical analysis used the Tukey–Kramer test. The data are representative of results from three independent experiments.

