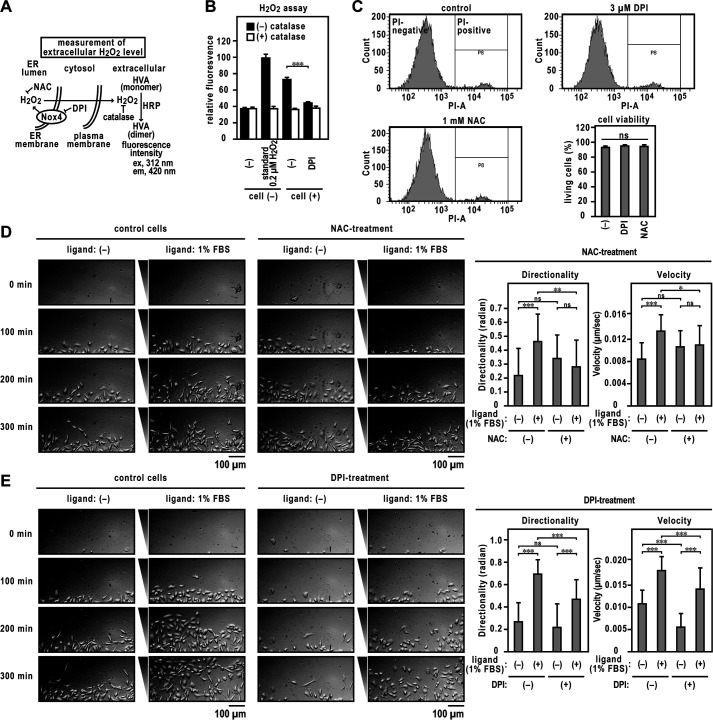
Figure 2.
Directed migration of DPI or NAC-treated ECs. A, schematic illustration of the experiment. See also the Experimental procedures for details. B, catalase-inhibitable H2O2 production by EA.hy926 cells. The panel shows the H2O2 production by EA.hy926 cells with or without DPI treatment. C, assay of cell viability. Viable cells were assessed as those that excluded PI staining (PI-negative). D and E, cell migration assay. Left, images of ECs migrating toward FBS in TAXIScan channels. The concentration of injected FBS was 1%. EA.hy926 cells were exposed to 3 μm DPI with or without 1 mm NAC for 48 h (added every 12 h). The distance between the start line (bottom) and finish line (top) of each channel was 260 μm. Scale bar, 100 μm. The bar graphs show the statistical analysis. Each graph represents the mean ± S.D. of pooled data of migrating cells (n ≥ 30) from three independent experiments. ***, p < 0.001. Statistical analysis used the Tukey-Kramer test. The data are representative of results from three independent experiments.

