Figure 4.
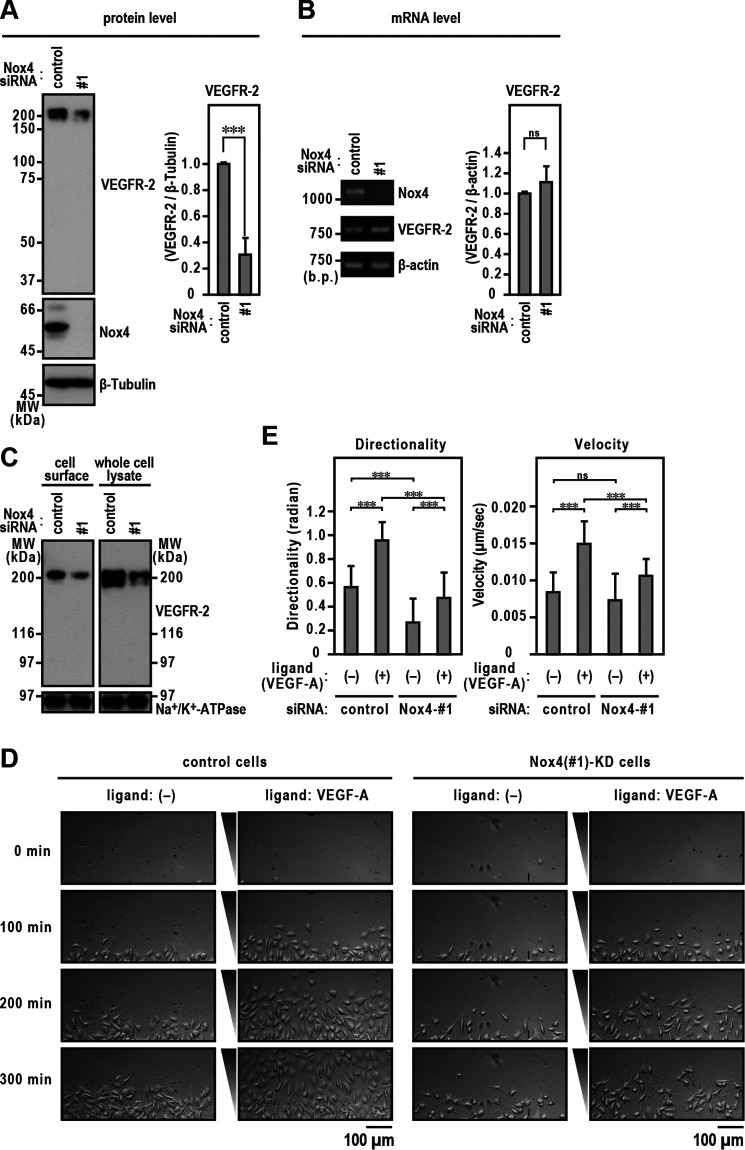
Maintenance of surface VEGFR-2 levels by Nox4. A, Nox4 and VEGFR-2 protein levels. Protein expression levels were analyzed by immunoblotting using the indicated antibodies. The bar diagram represents the relative density of the bands normalized to β-tubulin (n = 3). B, Nox4 and VEGFR-2 mRNA levels. The bar diagram represents the relative density of the bands normalized to β-actin (n = 3). C, cell surface VEGFR-2 levels. EA.hy926 cells were treated with Nox4 or control siRNA for 72 h. Cell surface biotinylation experiments were performed as described in Experimental procedures. Protein levels were analyzed by immunoblotting using anti-VEGFR-2. The positions of the marker proteins are indicated in kDa. D, images of ECs migrating toward FBS in TAXIScan channels. The concentration of injected human recombinant VEGF-A was 500 pg/ml. The distance between the start line (bottom) and finish line (top) of each channel was 260 μm. Scale bar, 100 μm. E, statistical analysis of VD plots. Each graph represents the mean ± S.D. of pooled data of migrating cells (n ≥ 30) from three independent experiments. ***, p < 0.001. Statistical analysis used the Tukey-Kramer test. The data are representative of results from three independent experiments.

