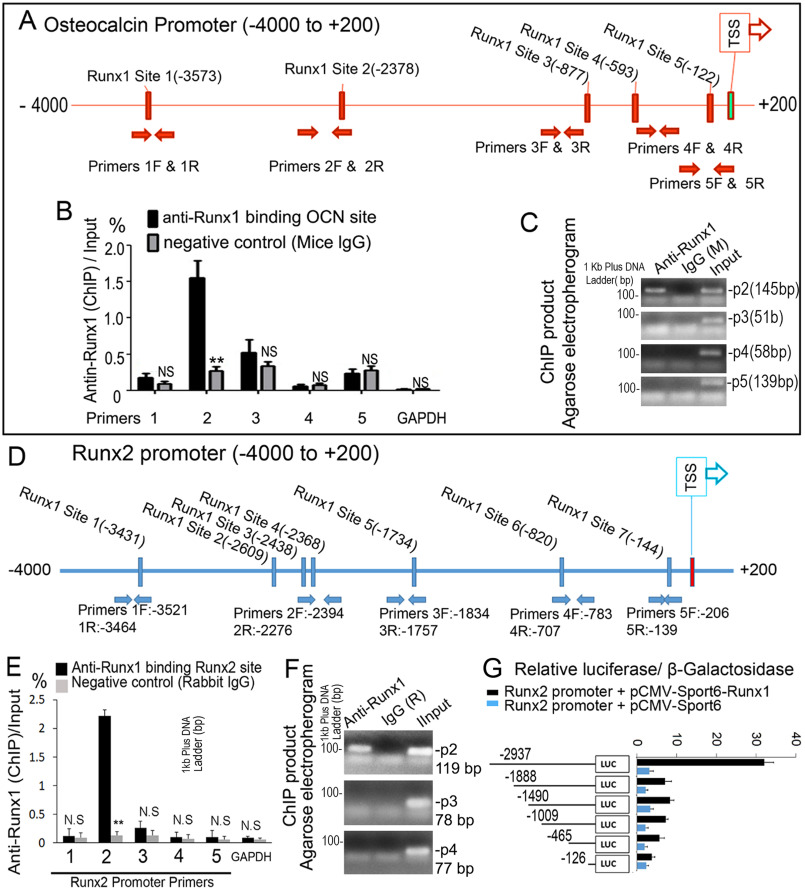
Figure 7.
RUNX1 regulates Runx2 expression by directly associating with its promoters. A, schematic display of the Ocn (–4000/+200) promoter region: TSS, predicted RUNX1-binding sites, and ChIP primers positions. B, ChIP analysis of RUNX1 binding to the Ocn promoter in WT calvaria-derived osteoblasts using primers as indicated on the x axis. Results are presented as ChIP/Input. C, agarose gel image using ChIP qPCR products in B. D, schematic display of Runx2 (–4000/+200) promoter region: TSS, predicted RUNX1-binding sites, and ChIP primers positions. E, ChIP analysis of RUNX1 binding to the Runx2 promoter in WT calvaria-derived osteoblast using primers as indicated on the x axis. Results are presented as ChIP/Input. F, agarose gel image using ChIP qPCR products in E. G, Runx2 promoter fragments were inserted into pG13-basic vector. C3H10T1/2 cells were transfected with pG13-Runx2 –126 bp, –465 bp, –1009 bp, –1409 bp, –1888 bp, and –2937 bp. Luciferase was detected at 48 h post-transfection and normalized to β-gal activity. Results are presented as mean ± S.D. with n = 3. N.S., not significant; *, p < 0.05; **, p < 0.01.

