
FIGURE 4.
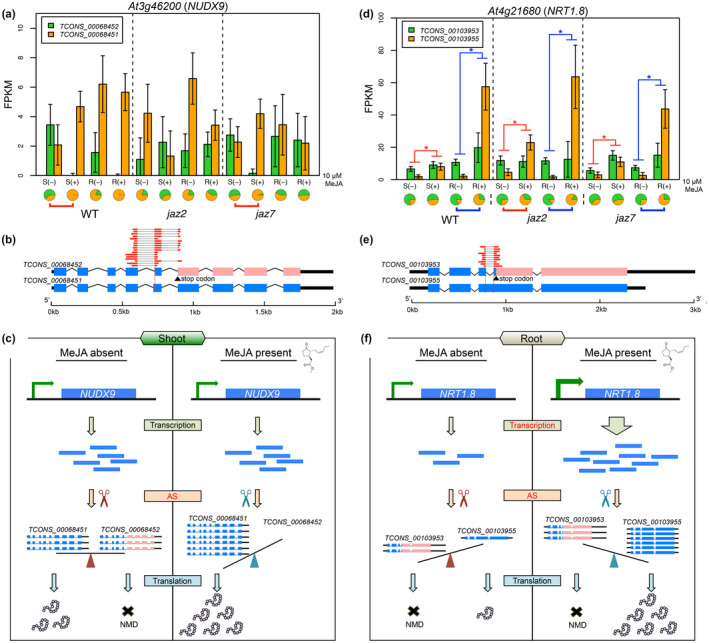
Two genes under AS regulation in response to MeJA treatment. (a) Expression profile of NUDX9. Error bars indicate standard deviation. Pie charts under each condition indicate the proportion of each AS isoform relative to the total expression from the locus. Red lines under pie charts indicate significantly differential AS in the shoot tissue. (b) Gene structure of the two isoforms of NUDX9. Angled lines indicate introns; thin black boxes indicate UTRs; blue boxes indicate CDS; pink boxes indicate regions which were converted to noncoding regions as a result of an AS induced PTC. Gray line connected red boxes indicate mapped reads supporting the novel junction in the alternative isoform. (c) Regulation of NUDX9 in response to MeJA treatment by AS. (d) Expression profile of NRT1.8. Blue lines under pie charts indicate significantly differential AS patterns in the root tissue. Red and blue lines above the barplot indicate significantly differential gene expression in shoot and root respectively. (e) Gene structure of the two isoforms of NRT1.8. (f) Regulation of NRT1.8 in response to MeJA treatment by transcription and AS