
FIGURE 7.
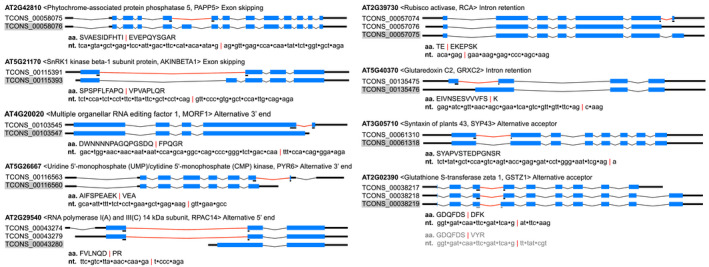
Proteomics validated AS isoform expression. Gene structure was displayed by Gene Structure Display Sever 2.0 (http://gsds.cbi.pku.edu.cn, Hu et al., 2013): thick black line—UTR; blue box—exon; angled line—intron; red angled line—intron splitting the junction of the transcript isoform supported by proteomics data; black/gray line under blue box—peptide mapped region. Shaded isoform name indicates primary annotated isoform from TAIR10 annotation