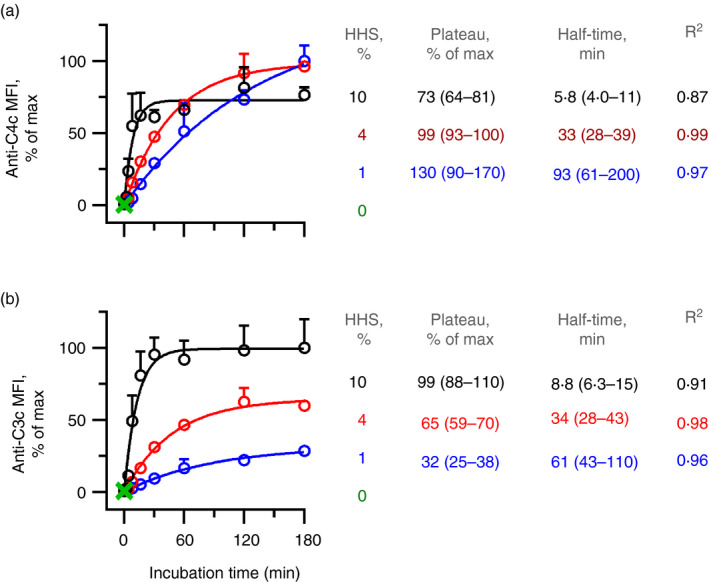
Figure 2.

Complement deposition increases with time and complement concentration. Complement deposition on pig red blood cells (pRBCs) was measured by flow cytometry using detection antibodies against C4c (a) or C3c (b). The pRBCs were incubated for various times at 37° in increasing concentrations (1%, 4% or 10%) of hypogammaglobulinaemia human serum (HHS) as the complement source with IgG anti‐αGal at 20 mg/l. The data are expressed as the mean and standard deviation of two independent experiments. Curve fitting was performed using one‐phase association modelling.
