
Figure 6.
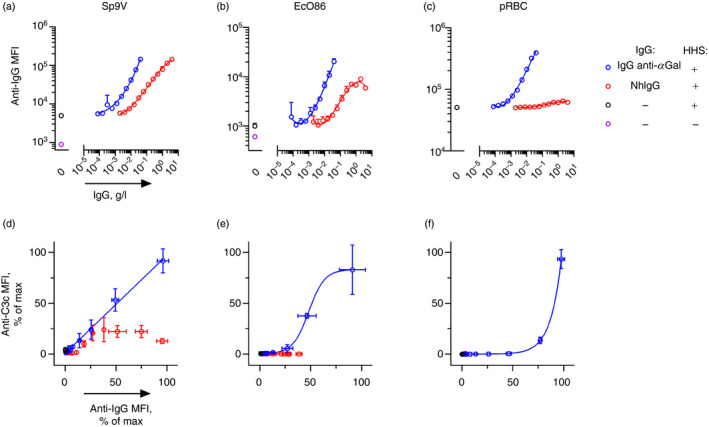
Binding and complement activation on cells by IgG anti‐αGal compared with normal human IgG. (a–c) Cell‐bound IgG as a function of IgG concentration examined by flow cytometry. IgG used in the experiments was either purified IgG anti‐αGal or was the source material for the purified IgG anti‐αGal (normal human IgG, nhIgG). Experiments contained 10 mm EDTA and hypogammaglobulinaemia human serum (HHS) (concentration in (a), 0% (−) or 10% (+); and in (b and c), 0% (−) or 4% (+)). The data are expressed as the mean and standard deviation of two independent experiments. Curve fitting was done by third‐order polynomial approximation. (d–f) Deposited C3 fragments as a function of cell‐bound IgG were examined by flow cytometry. Complement deposition was assayed in parallel and equivalent experiments as in panels (a–c) but without EDTA. The data for cell‐bound IgG were from panels (a–c). Curve fittings for IgG anti‐αGal‐associated data were performed in a linear model (d, R 2 = 1·00), a sigmoid model (e, R 2 = 1·00) and an exponential model (f, R 2 = 1·00).