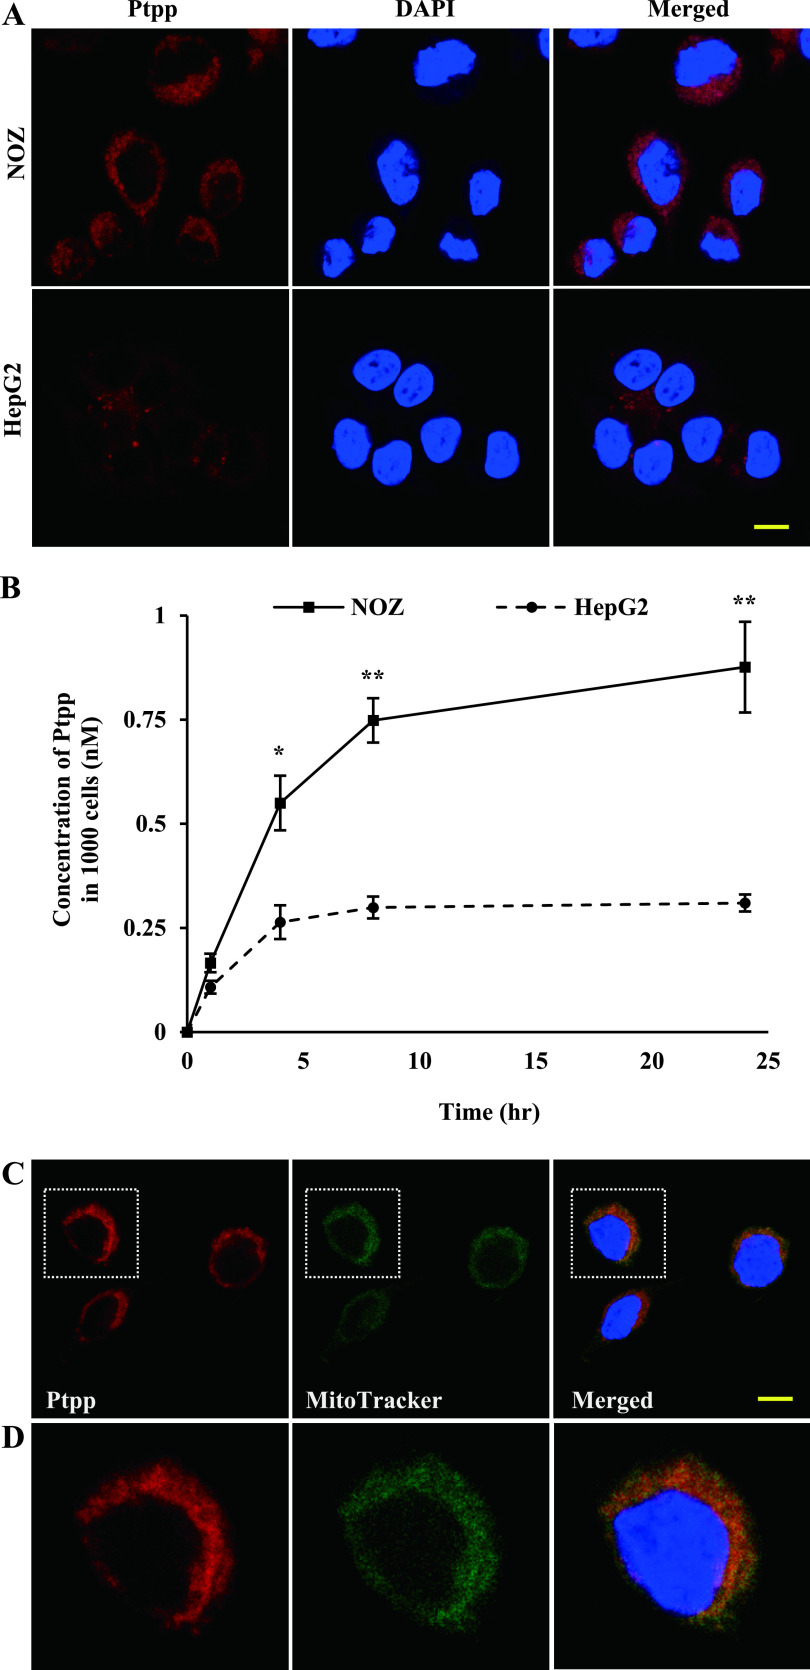
Fig. 2.
Uptake of Ptpp in NOZ and HepG2 cells, and subcellular localization of Ptpp in NOZ cells. (A) Fluorescence of Ptpp in NOZ and HepG2 cells. Cells were incubated with 50 nM Ptpp for 24 hr. Red and blue colors represent Ptpp and DAPI, respectively. Bar = 10 μm. (B) Quantitative analysis of Ptpp absorbance. Cells were incubated with 1 μM Ptpp for 1, 4, 8 or 24 hr. The results in the line graph are Ptpp concentrations in 1000 cells. *P < 0.05, **P < 0.01 vs. HepG2 cells at each time point. Data are shown as the mean ± SD of three independent experiments. (C) Low- and (D) high-magnification micrographs of subcellular localization of Ptpp in NOZ cells. Cells were incubated with 50 nM Ptpp for 24 hr and 200 nM MitoTracker Green® for 30 min. Red, green and blue colors represent Ptpp, MitoTracker and DAPI, respectively. Bar = 10 μm.

