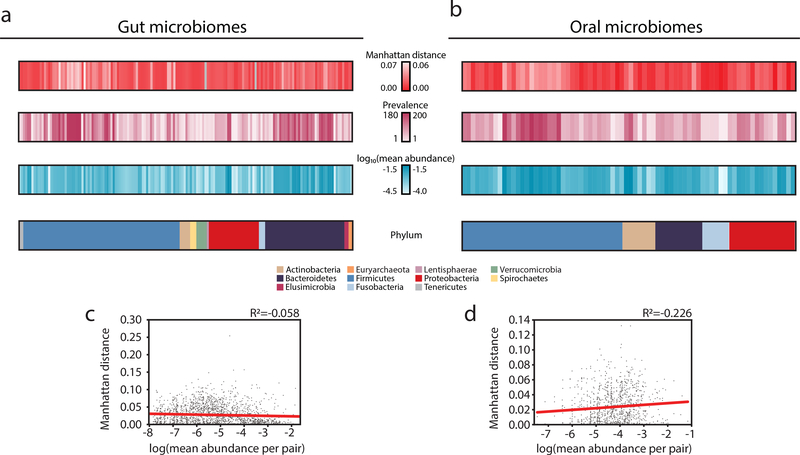
Figure 2. Organisms vary in their transmissibility across the social network.
(a,b) The mean Manhattan distance, prevalence (number of individuals who harbor that organism), log10(mean abundance) and phyla are plotted for organisms in the (a) gut (N=29) and (b) oral microbiomes (N=36) of spouses.
(c,d) The mean abundance of each organism across each pair of individuals is plotted against the Manhattan distance of that organism for that pair of individuals in the (c) gut (N=1,988) and (d) oral (N=1,111) microbiomes. Linear regressions are plotted in red.

