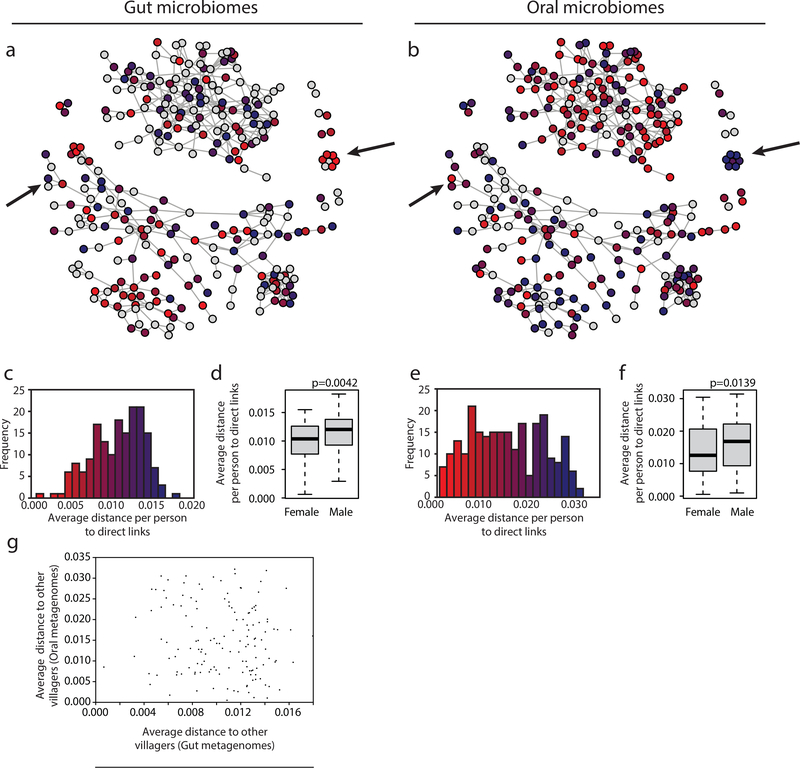
Figure 3. Some individuals are ‘supersharers’.
(a,b) For each person in the network, the average distance, defined as the median of mean Manhattan distances across all genomes to all directly connected individuals, is plotted for organisms within the (a) gut and (b) oral microbiomes. Arrows point out examples in which individuals’ sharing patterns are different for gut and oral microbiota. The red and blue in plots (a) and (b) match the values plotted in parts (c) and (e), respectively.
(c,e) The distribution of average distances (median of mean Manhattan distances) for each individual to all of their directly connected individuals is plotted for female and male individuals’ (c) gut (N=173) and (e) oral microbiomes (N=243).
(d,f) A histogram of the average distances (median of mean Manhattan distances) for each individual to all of their directly connected individuals is plotted for individuals’ (d) gut (N=173) and (f) (N=243) oral microbiomes. Boxes indicate the upper and lower quartiles, whiskers extend to highest and lowest values excluding outliers, and center lines indicate medians. P-values were obtained from one-tailed Wilcoxon rank sum tests.
(g) Each individual’s median of mean Manhattan distances to all individuals within the same village is plotted for their gut and oral microbiomes (N=142).

