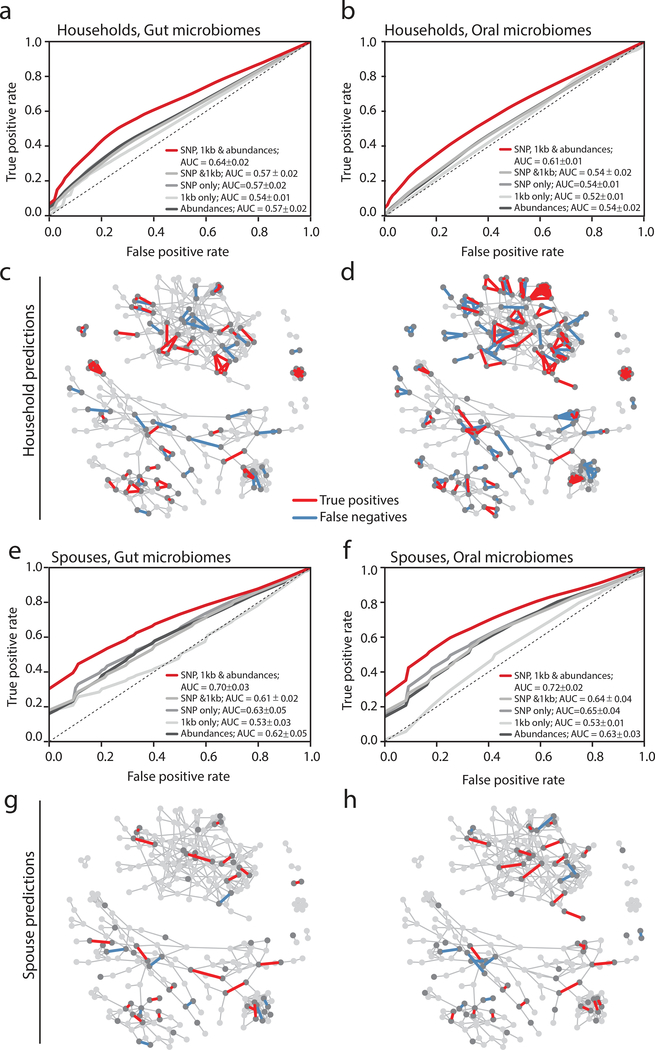
Figure 4. Machine learning predicts a subset of spouses with high confidence.
(a,b) ROC curves for a random forest model predicting household membership based on shared (a) gut or (b) oral microbiome strain-level data are plotted for models using SNP profiles, shared flexible regions, both, or both with organismal abundances. Random forest models were constructed from 1,000 decision trees and without constraint on maximum tree depth. The dotted line shows an ROC where false positives equal false negatives. The legend reports means and standard deviations for each classifier’s Area Under the Curve (AUC).
(c,d) The social network plotted with predicted true positive household pairs and false negative household pairs using gut (c) or oral (d) microbiome data. Arrows point to examples of either families in which everyone in a household can be confidently predicted.
(e,f) ROC curves for a random forest model predicting household membership based on shared (e) gut or (f) oral microbiome strain-level data are plotted for models using SNP profiles, shared flexible regions, both, or both with organismal abundances. Random forest models were constructed from 1,000 decision trees and without constraint on maximum tree depth. The legend reports means and standard deviations for each classifier’s AUC.
(g,h) The social network plotted with predicted true positive household pairs and false negative household pairs using gut (g) or oral (h) microbiome data. Arrows point to examples of either families in which everyone in a household can be confidently predicted.

