
Figure 2.
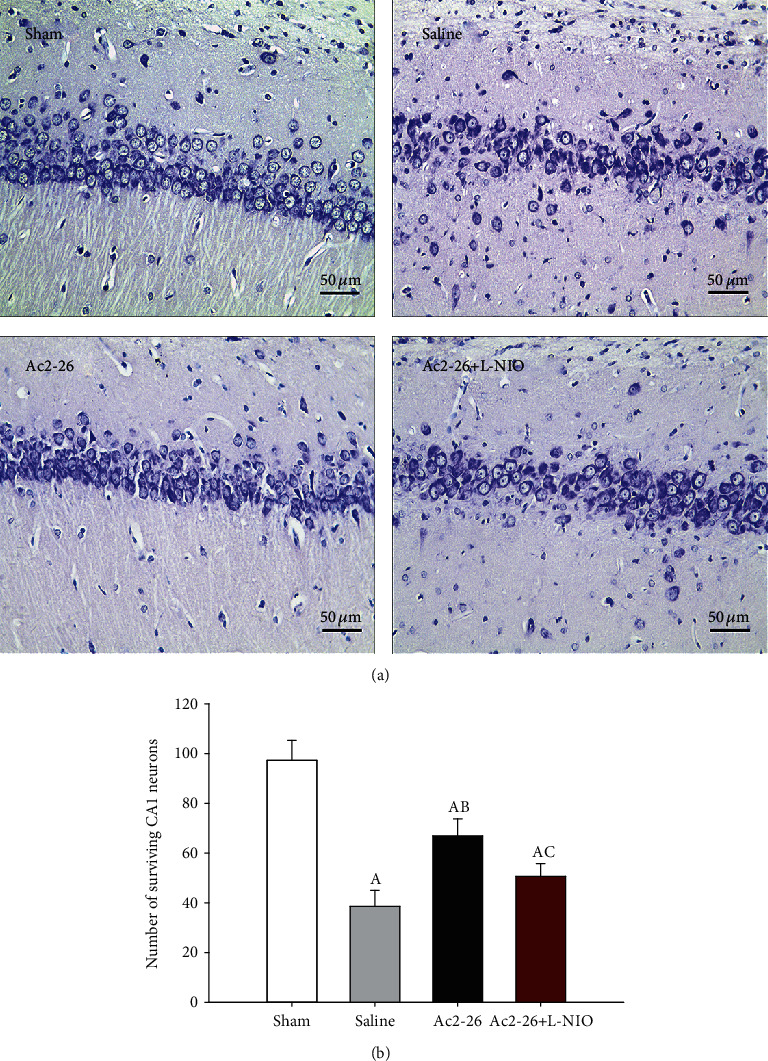
Number of surviving CA1 neurons after ROSC. Nissl staining was used to measure neuronal survival in the hippocampal CA1 region 72 hours after ROSC (magnification 400-fold) (a) The number of surviving neurons in the CA1 region of the hippocampus. (b) Data are presented as mean ± SD. AP < 0.05 vs. sham group; ABP < 0.05 vs. saline group; ACP < 0.05 vs. Ac2-26 group (, sham group; , saline group; , Ac2-26 group; , Ac2-26+L-NIO group).