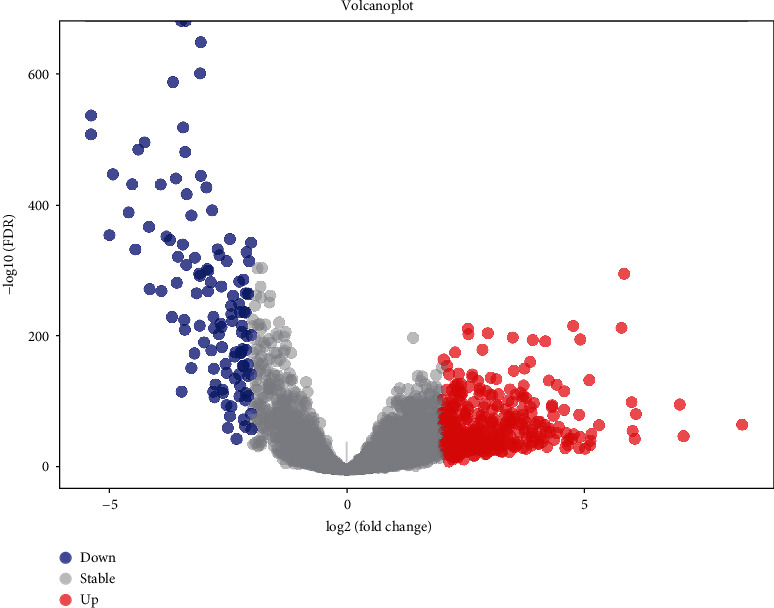
Figure 1.

The volcano diagram of differentially expresses lncRNA between breast cancer tissue and normal tissue samples. Red dots represent upregulated lncRNA, and blue dots represent downregulated lncRNA. Cutoff for |log2 (fold change)| is 2, FDR < 0.001.
