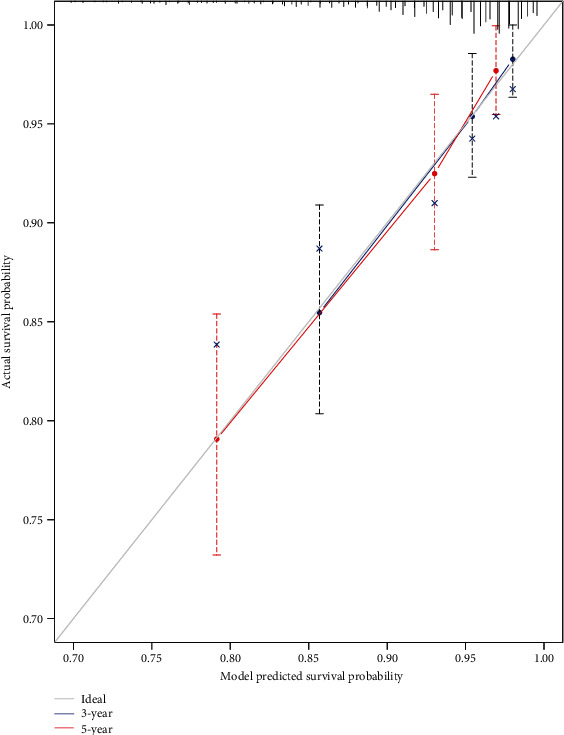
Figure 3.

Calibration curve of the prognostic model. The gray line indicates the ideal plot for the calibration curve. 3-year: 3-year overall survival predicted probability by model. 5-year: 5-year overall survival predicted probability by model. The bootstrap method was performed.
