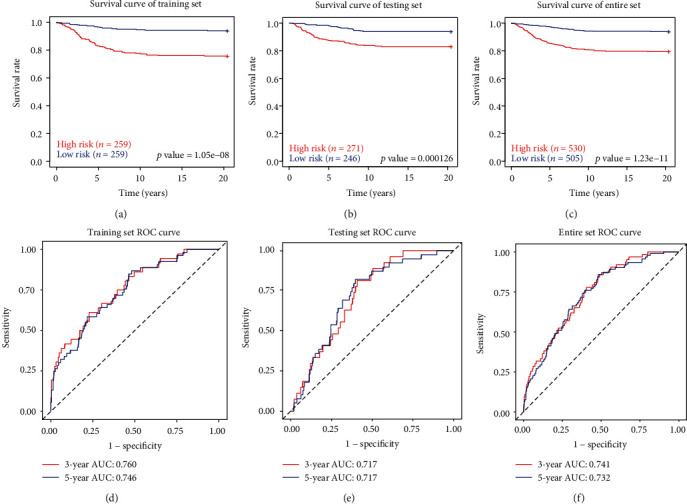
Figure 4.

The ten-lncRNA-related risk score model predicts the OS of patients with BRCA in the training set, test set, and entire set. The Kaplan–Meier survival curves show a correlation between the expression of ten-lncRNA signature and overall survival of patients (a–c). ROC curves show the sensitivity and specificity of the ten-lncRNA signature in predicting 3- and 5-year survival rate (d–f). ROC curve: receiver operating characteristic curve. AUC: area under curve. These curves were performed by R package “survival,” “survivalROC,” and “ggplot2”.
