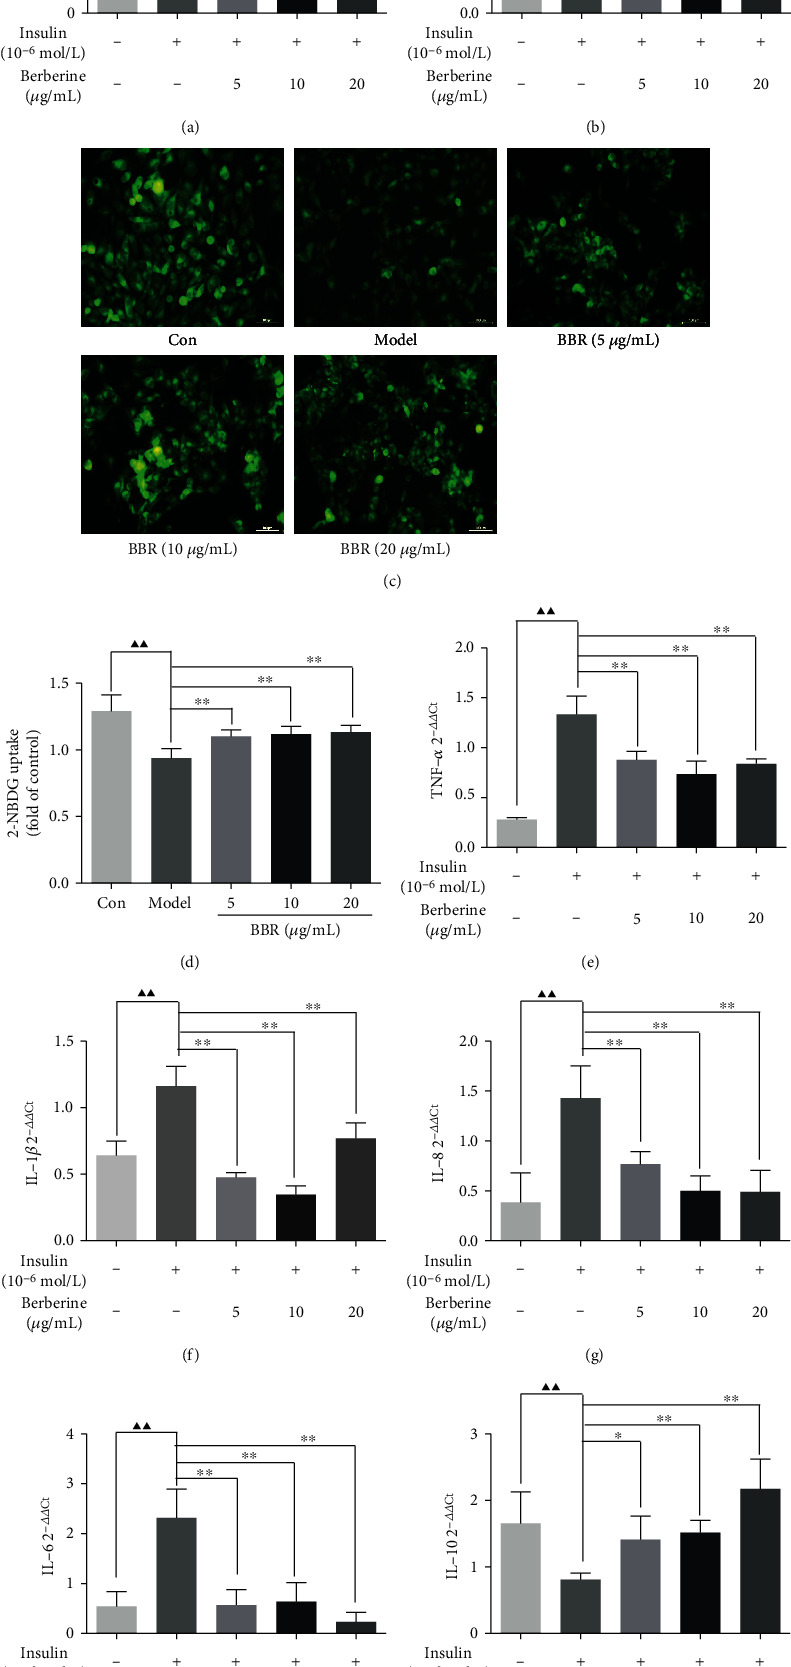
Figure 5.

Effect of BBR on glucose consumption, uptake, and inflammatory factors in HepG2-IR cells. (a) Glucose consumption from the culture medium after 24 h treatment. (b) Cell viability of HepG2 cells. (c) Uptake of 2-NBDG into HepG2-IR cells. (d) The quantitative analysis of fluorescence from eight independent replicates. (e–i) The expression of TNF-α, IL-1β, IL-6, IL-8, and IL-10 in HepG2-IR cells was measured by qPCR. ▲P < 0.05 and ▲▲P < 0.01, Con vs. model; ∗P < 0.05 and ∗∗P < 0.01, model vs. BBR-treated groups.
