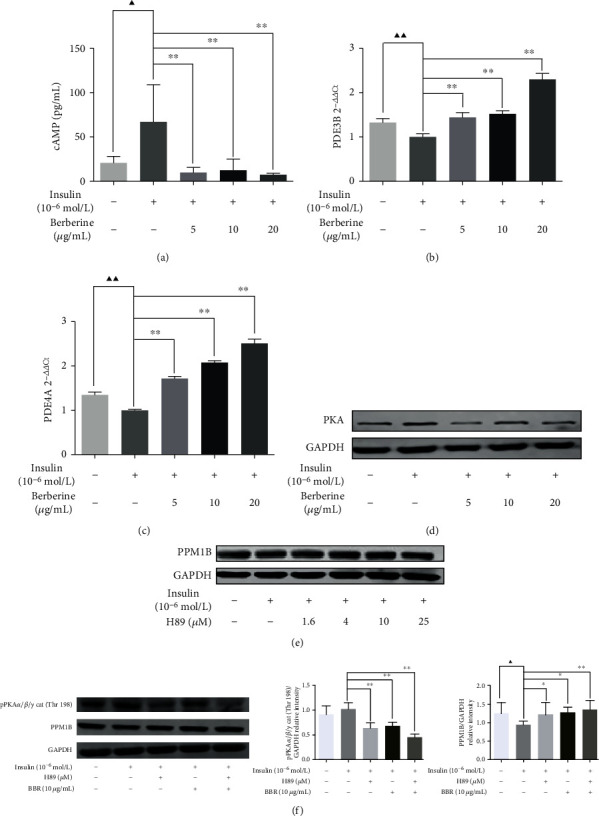
Figure 6.

Effect of BBR on the PPM1B/cAMP/PKA pathway in HepG2-IR cells. (a) The content of cAMP measured by the ELISA kit. (b) PDE3B and (c) PDE4A mRNA expression evaluated with qPCR. (d) PKA, (e) PPM1B, and (f) phosphorylated PKA protein levels in total HepG2-IR cell extracts. ▲P < 0.05 and ▲▲P < 0.01, Con vs. model; ∗P < 0.05 and ∗∗P < 0.01, model vs. H89/BBR-treated groups.
