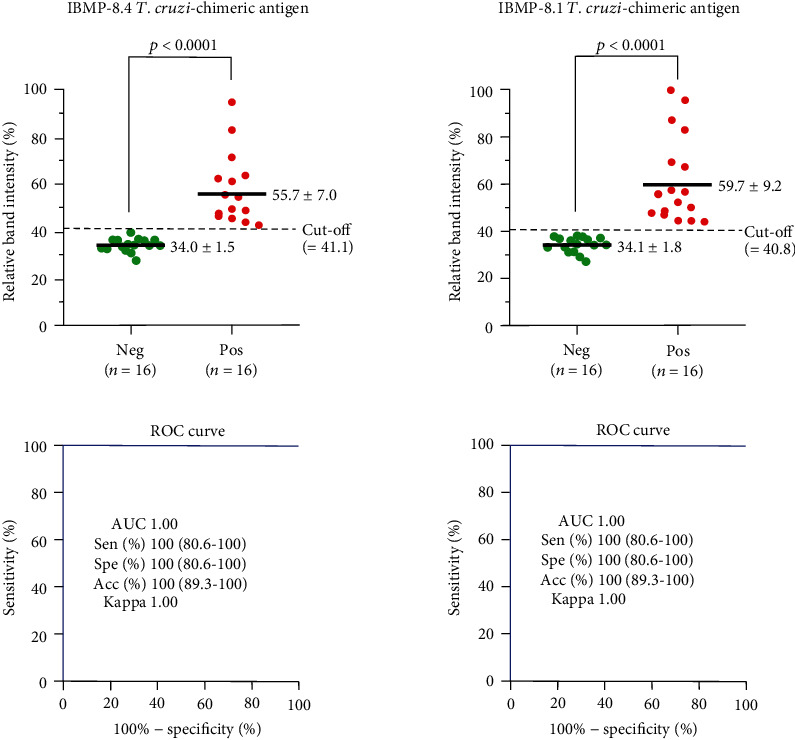
Figure 4.

Assay performance parameters were obtained with serum from noninfected and T. cruzi-infected individuals. The cut-off value is represented by the dotted lines. Horizontal lines and numbers for each group of results represent the geometric means (±95% CI). Acc (accuracy); AUC (area under curve); ROC curve (receiver operating characteristic curve); Sen (sensitivity); Spe (specificity).
