
Figure 3.
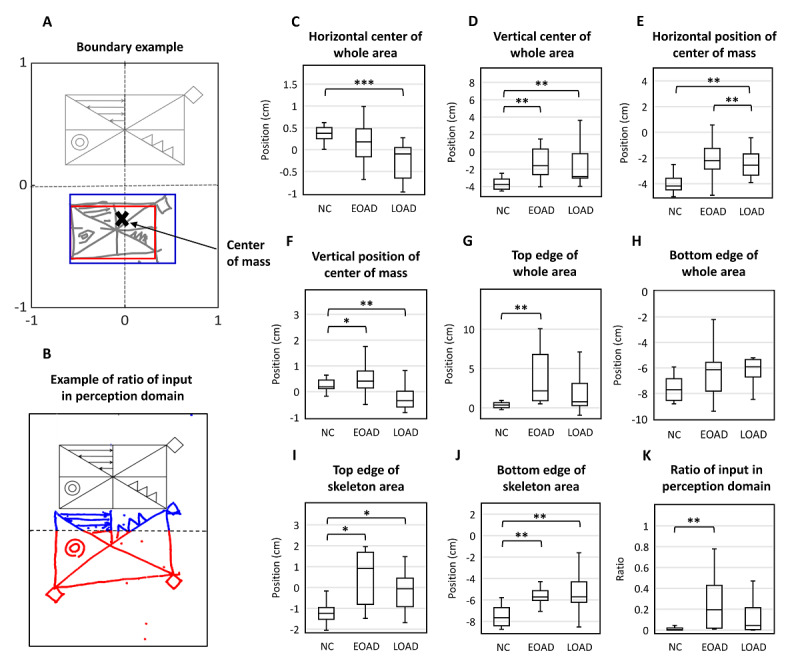
Spatial arrangement. (A) We defined the bounded area that contains the whole drawing as the whole area (blue box) and a boundary that contains only the area inside the skeleton rectangle as the skeleton area (red box). (B) An example of the ratio of input in perceptual space: input (blue)/total input (blue + red). (C-D) Center of the whole area. (E-F) Center of mass of the whole area. (G-H) Top and bottom edge of the whole area. (I-J) Top and bottom edges of the skeletal area. (K) Closing-in phenomenon. One, two, and three asterisks show significant differences at P<.05, P<.01, and P<.001 levels, respectively. EOAD: early-onset Alzheimer disease; LOAD: late-onset Alzheimer disease; NC: normal control; RCFT: Rey-Osterrieth Complex Figure Test.