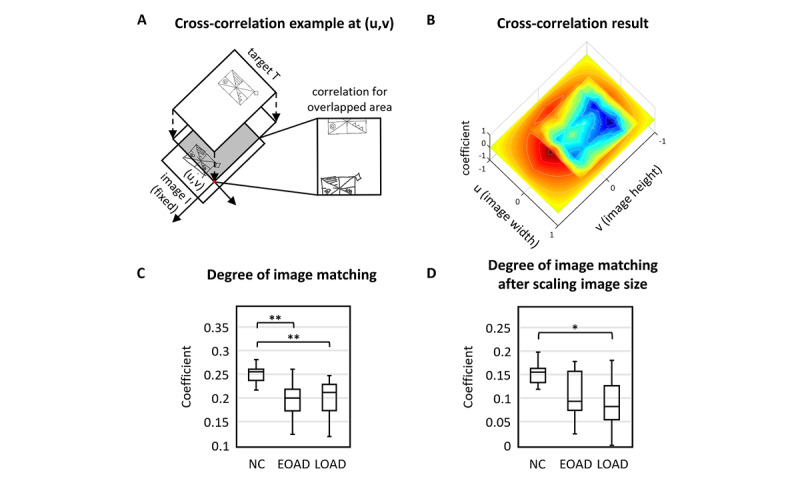
Figure 4.

Shape similarity between the target and the pictures drawn by the participants. (A) The Pearson correlation coefficient was used to assess cross-correlation for all possible overlap. (B). We applied 2D cross-correlation analysis and calculated its coefficient and shift in space. (C) For both AD groups, pattern matching was significantly poorer than that of the normal control (NC) group (pairwise Mann-Whitney U test: P=.004 for early-onset Alzheimer disease [EOAD] vs NCs and P=.002 for late-onset Alzheimer disease [LOAD] vs NCs). There was no statistical significance between the EOAD and LOAD groups (P=.86). (D) Although the amount of difference was reduced, the similarity was significantly lower for the LOAD group even after rescaling the image size (P=.04). There was no statistical significance for the EOAD group even after adjusting for image size. One and two asterisks show significant differences at P<.05 and P<.01 levels, respectively. RCFT: Rey-Osterrieth Complex Figure Test.
