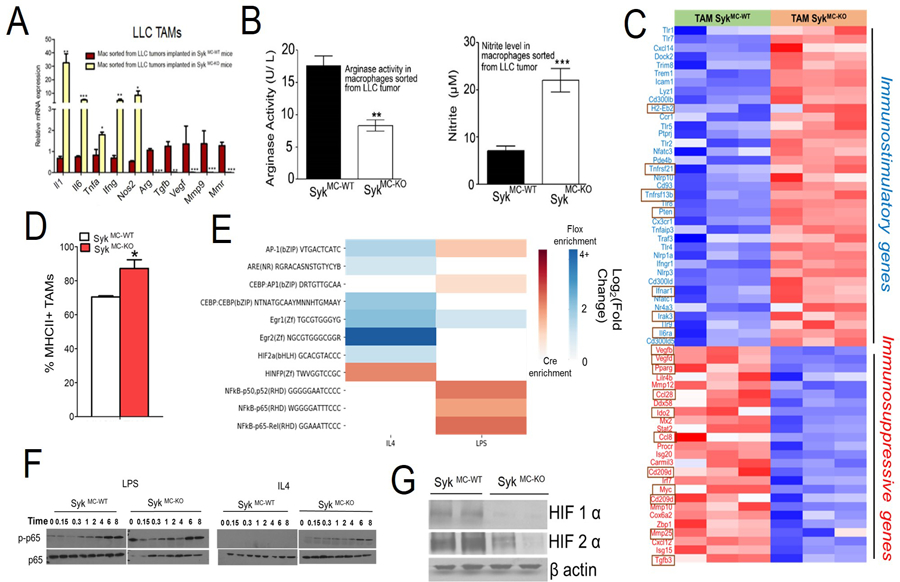
Figure 2: Syk kinase promotes macrophage polarization and immune suppression.

A. RTPCR analysis of cDNAs reflecting TAMs isolated from LLC tumors grown in SykMC-WT and SykMC-KO animals (n=3), student’s t-test. B. Arginase (Left panel) and nitrite production (Right panel) was assayed in the TAMs isolated from the tumors (n=3). C. Heat map of immune related mRNA expression in SykMC-WT versus SykMC-KO TAMs isolated from LLC tumors implanted in these mice (n=3). D. MHC II expression on SykMC-WT and SykMC-KO TAMs gated on CD11b+F4/80+ population (n=4). E. Differential enrichment heatmap of Log-2 fold change for immune-related transcription factor binding motifs in open chromatin segments, found via ATAC-seq, of cre and flox macrophages exposed to IL4 and LPS. Blue-colored cells represent higher enrichment in flox (SykMC-WT) mice and red-colored cells represent higher enrichment in cre (SykMC-KO) mice. F. Immunoblotting of p-p65 (pRelA), p-65 (RelA), in LPS or IL4 stimulated BMDMs from SykMC-WT vs SykMC-KO mice. G. Western blot analysis of nuclear extracts for HIF1α or HIF2α from SykMC-WT vs SykMC-KO BMDMs incubated under hypoxic conditions (1% O2). All experiments were performed 2–3 times. Graphs in A, B and D represent mean ± SEM, where * represents p < 0.05, ** represents p < 0.01, ***represents p < 0.0001, analyzed by t test.
