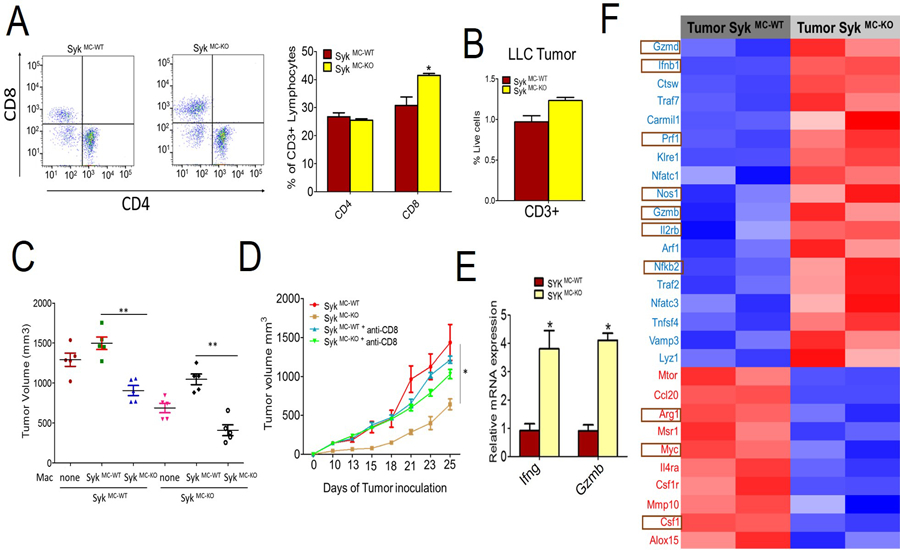
Figure 3: Syk kinase inhibits CD8+ T cell recruitment and activation.

A and B. Flow cytometric representation of percentage of CD4+ and CD8+ T cells (gated on CD3+ cells) (A, left panel) and quantification of these cells (A, right panel) and CD3+ cells (B) in the LLC tumors implanted in SykMC-WT and SykMC-KO mice. (n=3, p<.05, t test) C. Tumor volumes of LLC tumors implanted in SykMC-WT and SykMC-KO animals adoptively transferred with TAMs from SykMC-WT and SykMC-KO animals. Data was analyzed by one-way ANOVA using Tukey’s multiple comparisons, ** represents p < 0.01 compared to SykMC-WT. D. LLC tumor volume from SykMC-WT and SykMC-KO mice treated with anti-CD8 or isotype control antibodies (n=5). E. mRNA expression of Ifng and Gzmb in LLC tumors implanted in SykMC-WT and SykMC-KO mice (n=5, p < 0.05, t test). F. Heat map of log2 fold differences from sample wise mean expression for selected T cell activation genes that were differentially expressed in LLC tumors from SykMC-WT versus SykMC-KO mice conditions (n=2). Graphs in A-E represent mean ± SEM.
