Figure 1.

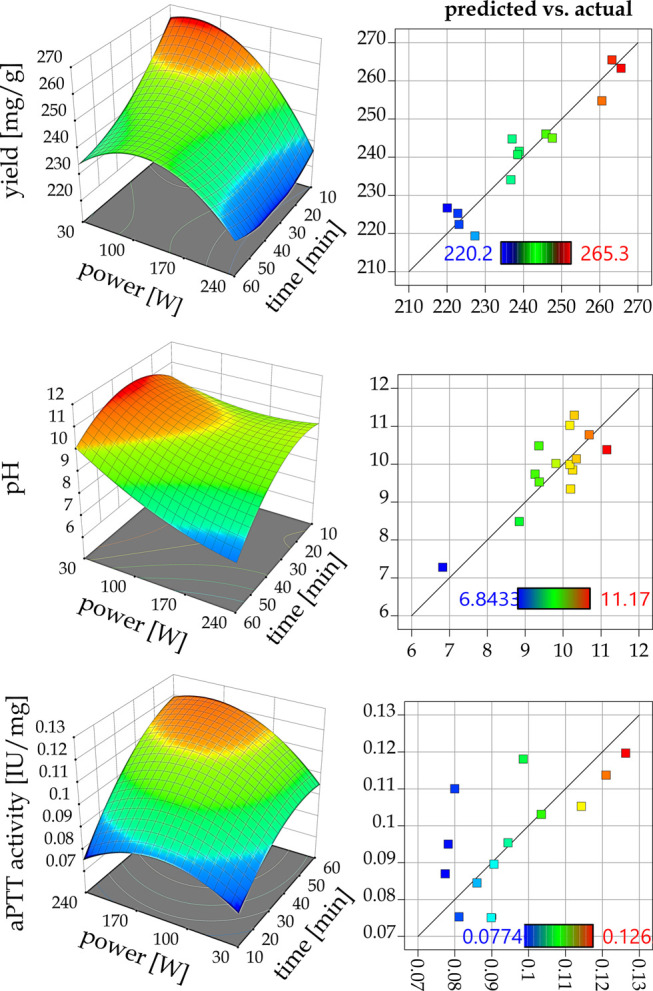
Graphical representation of the 24I-optimal design response surfaces for the dependent variables Y1 = yield, Y2 = pH, and Y3 = aPTT activity vs independent variables (time, power) and actual model fitting.

Graphical representation of the 24I-optimal design response surfaces for the dependent variables Y1 = yield, Y2 = pH, and Y3 = aPTT activity vs independent variables (time, power) and actual model fitting.