
Figure 1.
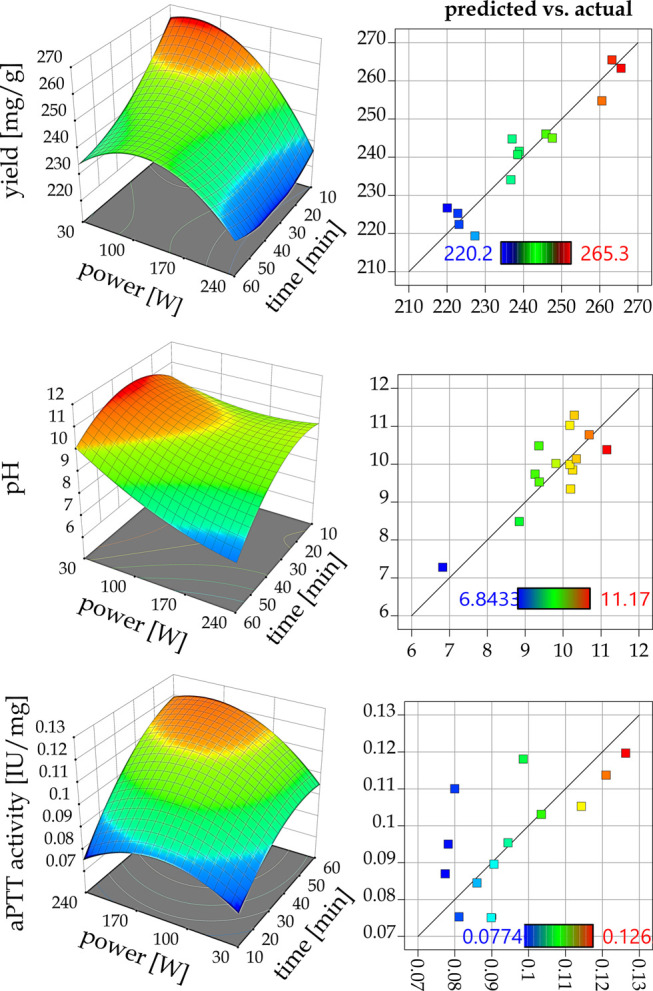
Graphical representation of the 24I-optimal design response surfaces for the dependent variables Y1 = yield, Y2 = pH, and Y3 = aPTT activity vs independent variables (time, power) and actual model fitting.
Official websites use .gov
A
.gov website belongs to an official
government organization in the United States.
Secure .gov websites use HTTPS
A lock (
) or https:// means you've safely
connected to the .gov website. Share sensitive
information only on official, secure websites.
Graphical representation of the 24I-optimal design response surfaces for the dependent variables Y1 = yield, Y2 = pH, and Y3 = aPTT activity vs independent variables (time, power) and actual model fitting.