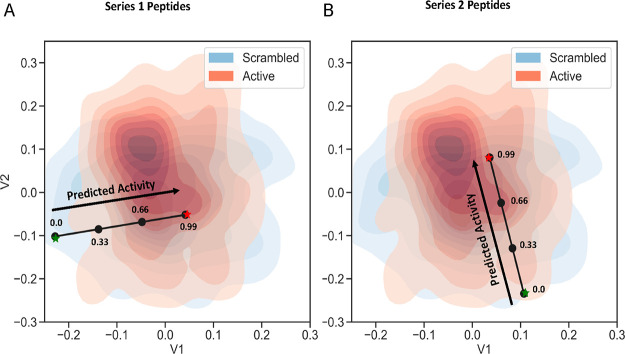
Figure 3.
Latent space plots. Latent space maps were generated from the APD3 database (plus scrambled sequences). Antimicrobial concept vector (black line) with stepwise sampling shown, extending from the scrambled peptide (A) SP1 (green star) to P1 (red star) and (B) SP2 (green star) to P2 (red star). V1 and V2 are latent variables 1 and 2, respectively. Antimicrobial activity (black arrow) is expected to increase or decrease proportional to the distance from the scrambled/inactive (SP) or active (P) position. Peptide sequences for each point in the space can be found in Table 1.

