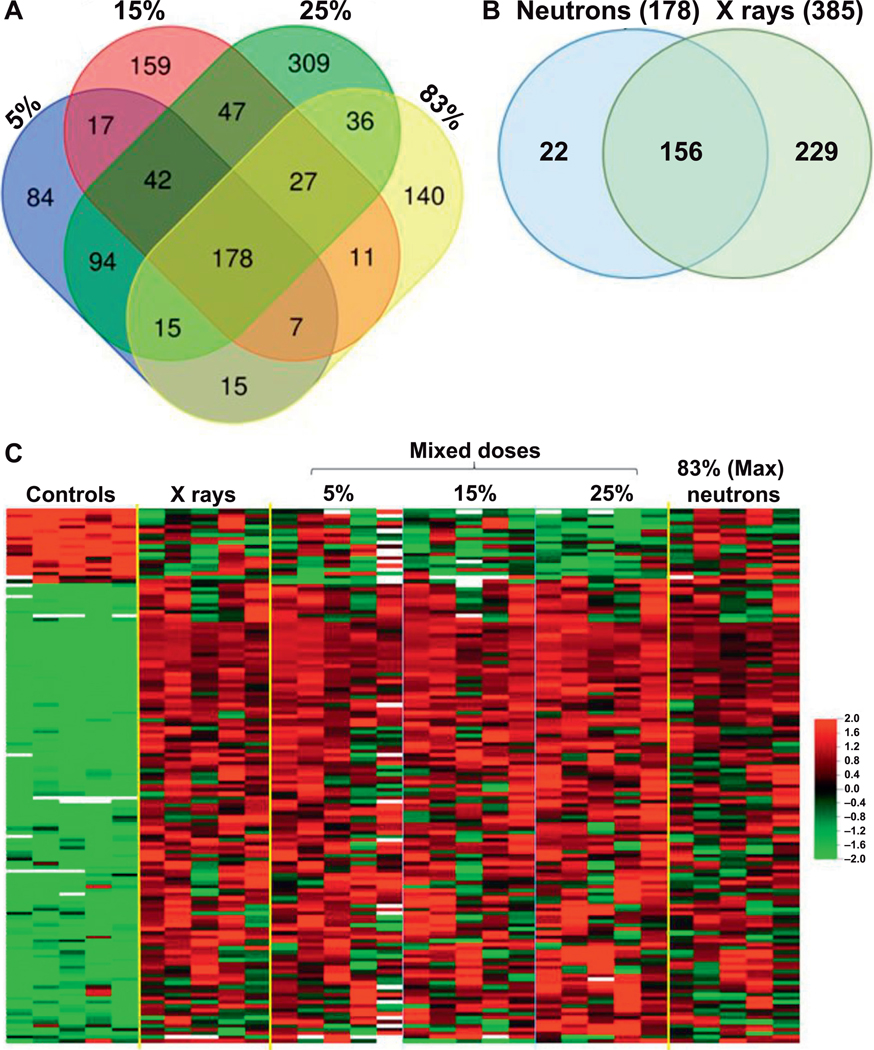
FIG. 1.
Differentially expressed genes (P < 0.005 and FDR < 10%) Panel A. Venn diagram of differentially expressed genes at different neutron exposures showing overlapping number of genes between different neutron containing exposures (5–83% neutron). In the analysis, 178 common differentially expressed genes were identified across neutron-containing exposures. Panel B. Venn diagram comparing differentially expressed genes in neutron-containing exposures (5–83% neutron) vs. pure X rays (0% neutron). In the analysis, 156 common differentially expressed genes were identified across all exposures. Panel C. Heatmap illustrating expression levels of the common 156 genes across different exposures. “Mixed doses” indicate the percentage neutron exposure in the dose, and “(max). neutron” indicates the exposures of 0.75 Gy neutron, plus 17% contaminating gamma rays. Red indicates high expression and green indicates low expression as shown in the color key. Each row represents one gene and each column represents an individual donor sample.

