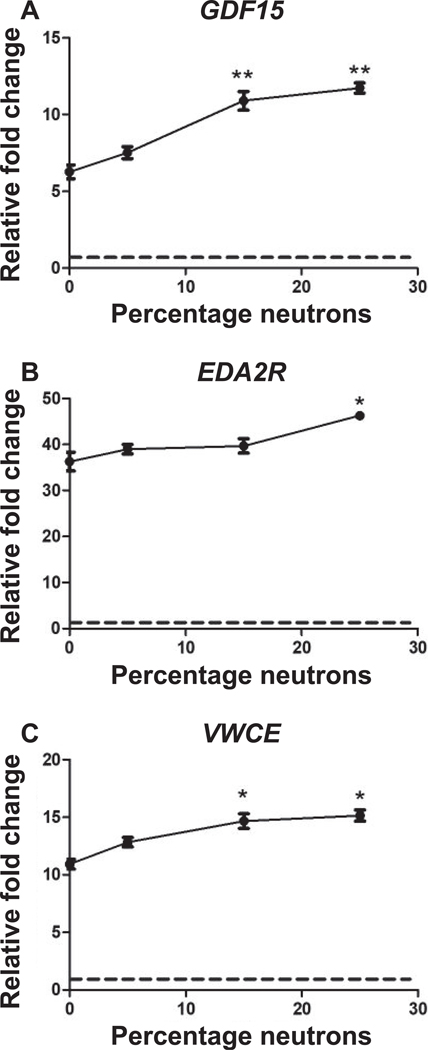
FIG. 2.
Real-time quantitative PCR of the genes (panels A–C), GDF15, EDA2R and VWCE, respectively, showing a trend of increased expression in response to a 3 Gy dose with increasing neutron percentages (0% to 25%) in the mixed neutron-photon radiation exposure. The points indicate mean ± SD (n = 5) per exposure condition. **Significant at P < 0.01; *significant at P < 0.05 compared to 0% neutron (X rays) using paired t test analysis. The dashed lines indicate the level in sham-irradiated controls.

