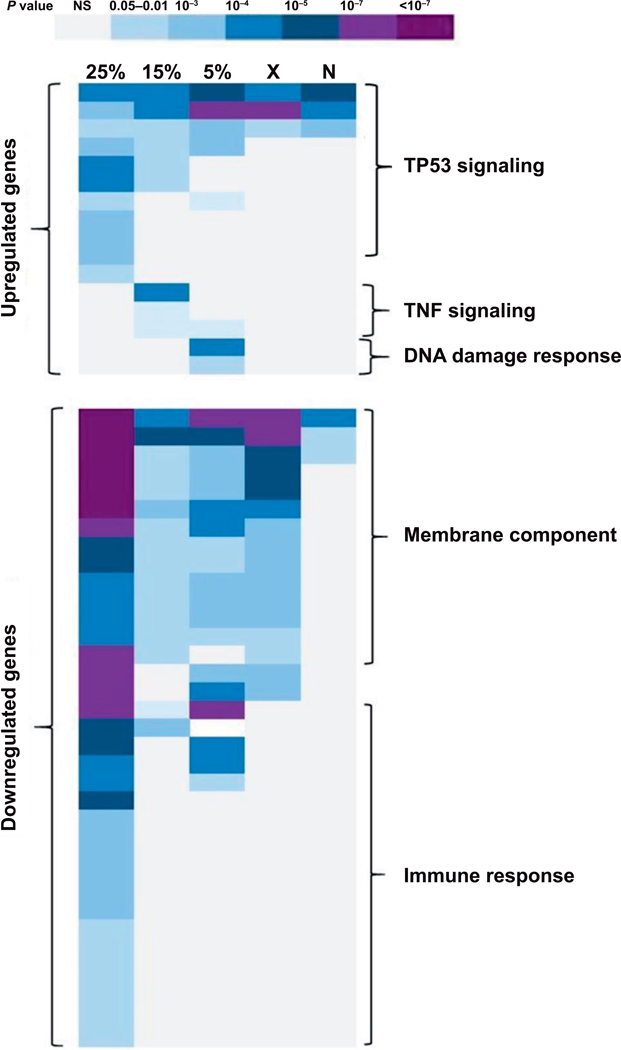
FIG. 3.
Gene ontology (GO) enrichment analysis of differentially expressed genes across all exposures. Using DAVID software (23), the Benjamini corrected P value (P < 0.05) was used for selecting enriched GO categories for each exposure. Darker colors indicate lower P values according to the key. 25% = 25% mixed neutron exposure; 15% = 15% mixed neutron; 5% = 5% mixed neutron; X = 0% neutron (X rays); N = maximum neutron. The predominant biological processes (GO categories) in each region of the heatmap are marked in the figure, with full annotation of individual categories and corresponding P values available in Supplementary Table S2 (http://dx.doi.org/10.1667/RR15281.1.S2).

