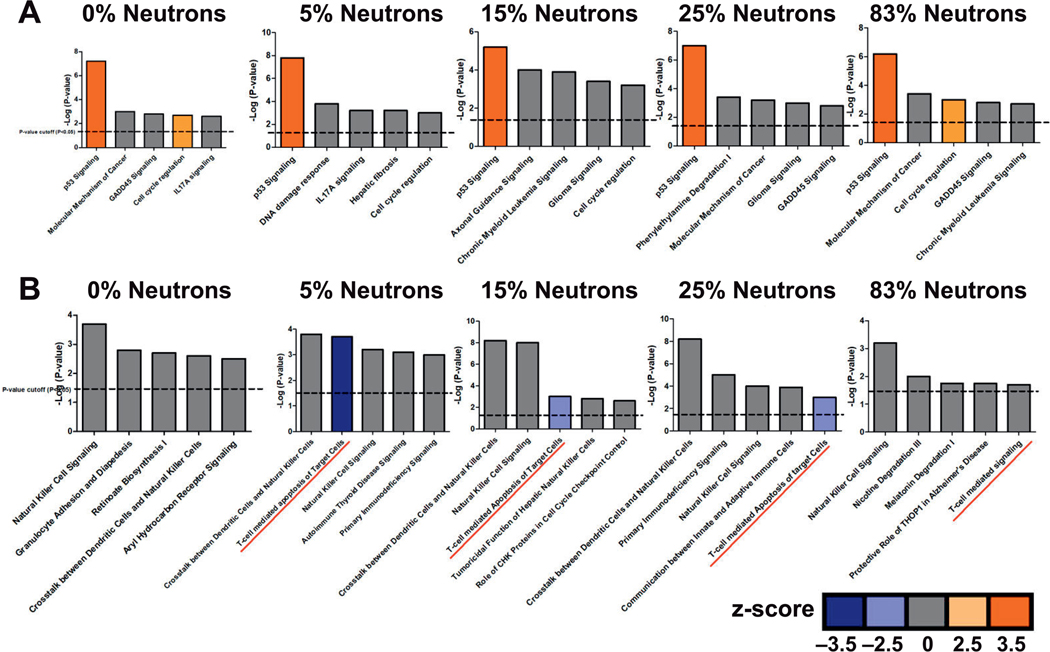
FIG. 4.
Ingenuity Pathway Analysis (IPA) of the top five canonical pathways (P < 0.05) for each exposure group. The bars represent significant canonical pathways associated with (panel A) upregulated genes and (panel B) downregulated genes in a particular neutron-photon exposure arranged based on their P values (–log; dashed line indicates P = 0.05). The colored bars indicate the predicted activity status of that particular pathway based on statistical z-score (color key). Orange indicates activation (z > 2); blue indicates inhibition (z < −2) and gray indicates no activity pattern available.

