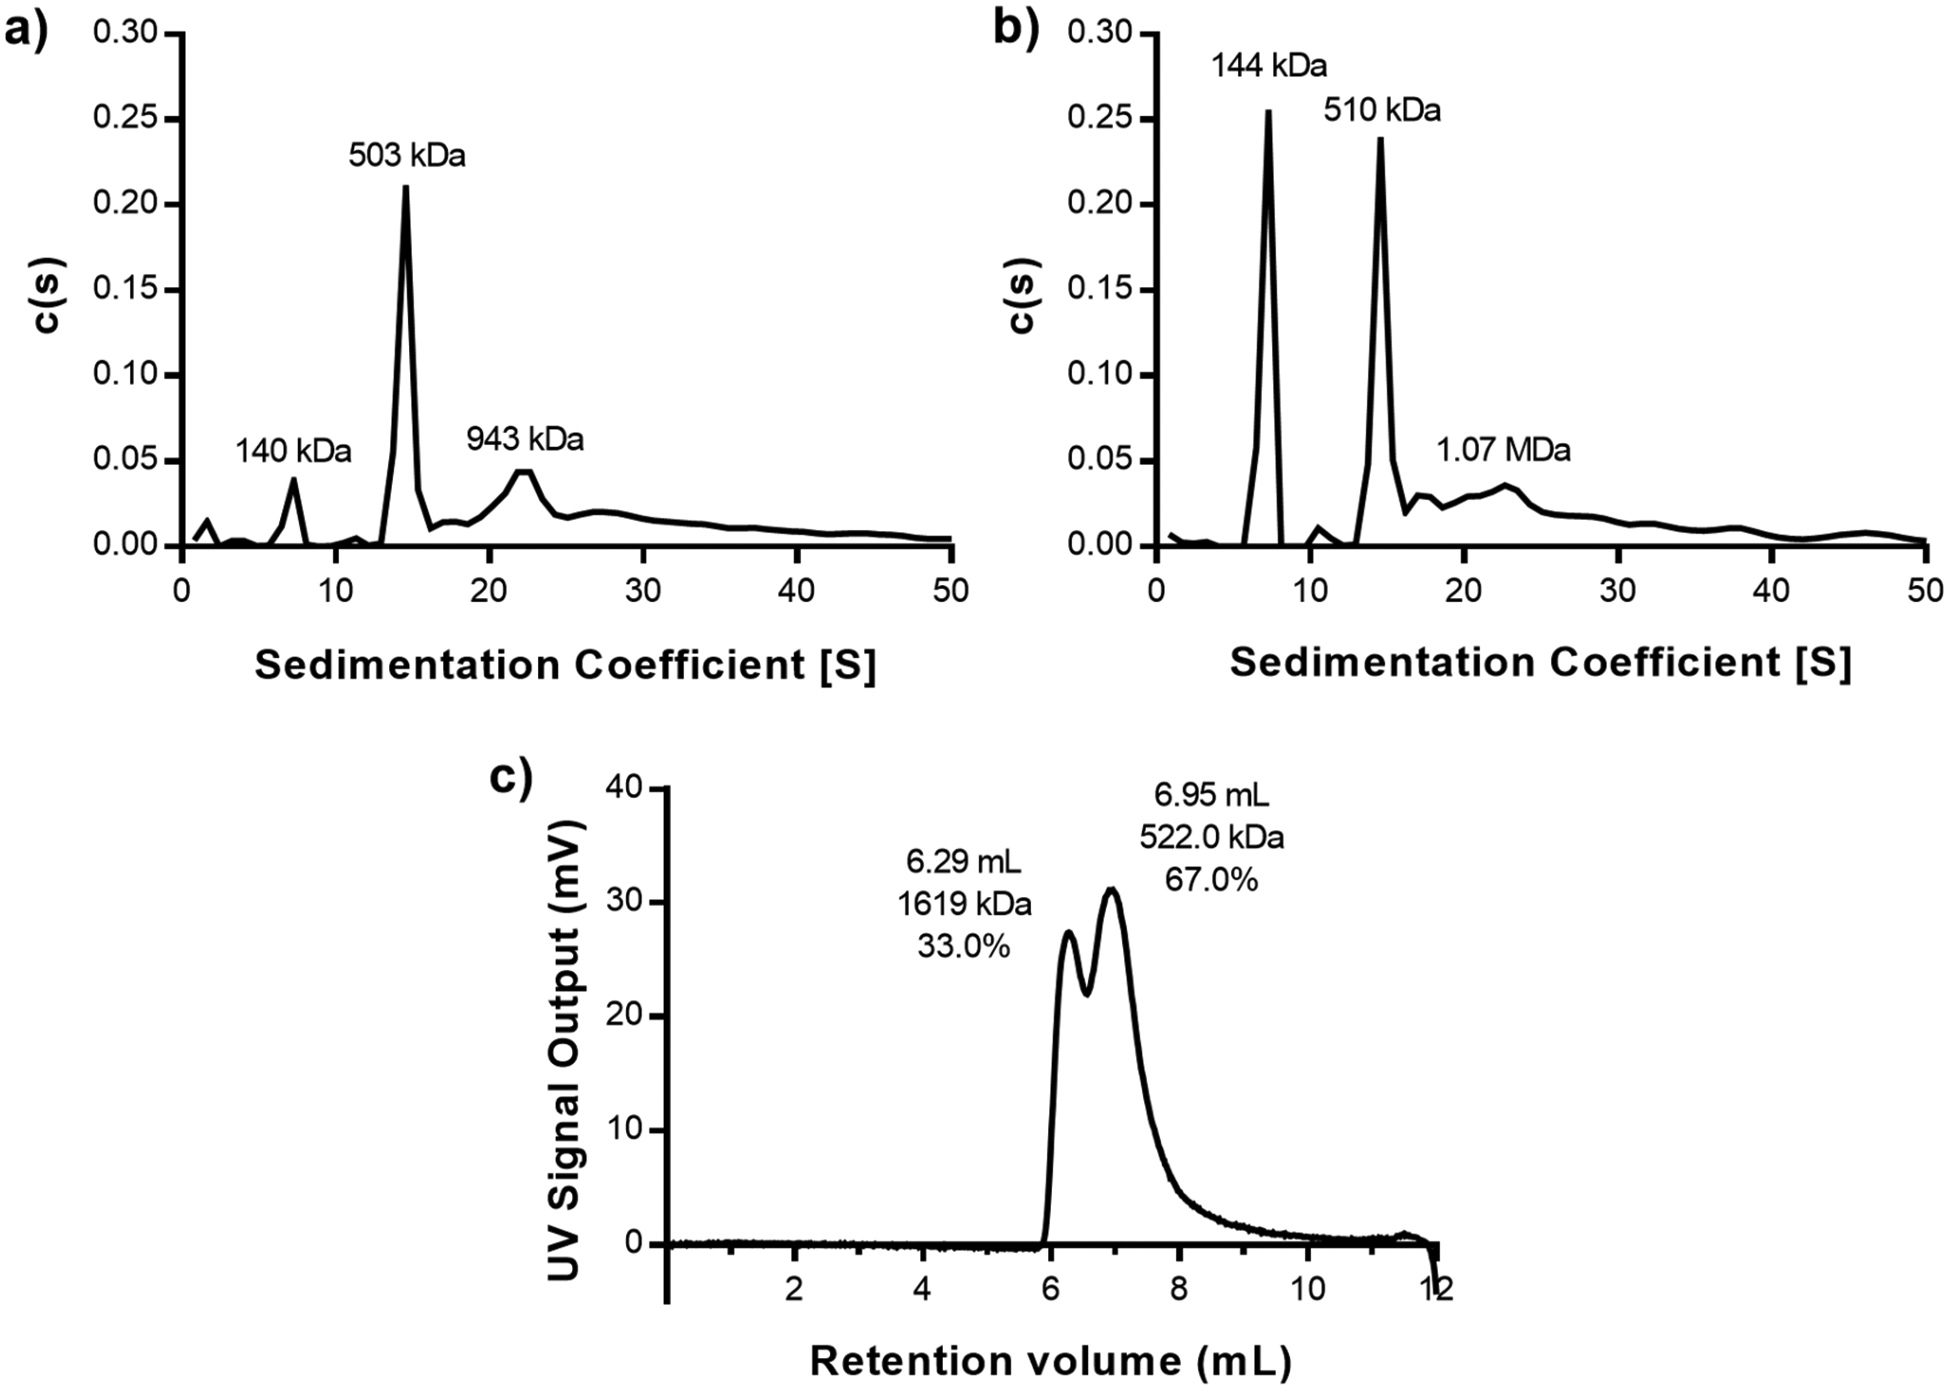
Figure 3.

(a and b) Sedimentation coefficient distributions obtained from AUC for a Hex–IgG sample in a (a) 1:3 ratio or a (b) 1:4 ratio. Molecular weights above peaks represent estimates of each species in the mixture. (c) OmniSEC chromatogram of Hex–IgG sample in a 1:3 ratio analyzed immediately after mixing. Retention volume, molecular weight estimate, and peak area % of sample are listed above each identified peak.
